When I bought my new and shinny Lenovo P1 at the beginning of the year I choose a configuration that had 2 NVMe drives; one of 500GB and the other of 256GB. Innocently I thought that this would be plenty. But since I started hogging my test VMs and creating videos with my GoPro and DaVinci Resolve (while we are here, check out my YouTube channel), that storage space quickly became too small and I knew I had to update my storage!
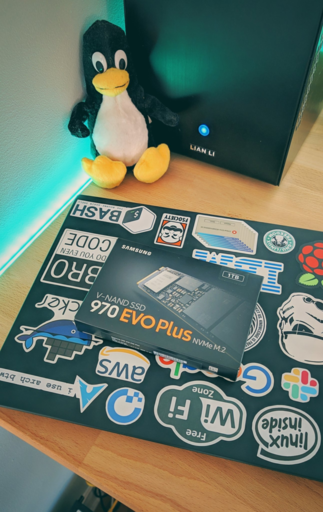
Taking advantage of a great Black Friday deal I scored a 1TB Samsung 970 Evo Plus NVMe drive for almost half the price.
Preparation
I had my hard drives organized into partitions as follows:
nvme0n1             259:0    0 476.9G  0 disk
├─nvme0n1p1         259:1    0   250G  0 part /home
└─nvme0n1p2         259:2    0 226.9G  0 part /mnt/storage2
nvme1n1             259:3    0   256G  0 disk
├─nvme1n1p1         259:4    0   512M  0 part /efi
├─nvme1n1p2         259:6    0    32G  0 part [SWAP]
├─nvme1n1p2         259:7    0   110G  0 part /
└─nvme1n1p2         259:8    0    96G  0 part /mnt/storage1
The partitions ‘storage1’ and ‘storage2’ are used for video and virtual machine storage.
My plan was to replace the smaller drive and copy my partitions to the new drive as LV. This is pretty straight forward, you just need some additional steps if your root partition will be in the LV. I’m however leaving my EFI partition as a standard partition for simplicity and compatibility.
If you are using this post as a guide, please take the time to compare my configuration to yours and make sure that it will work for you. You will most likely need to tweak a few steps. Also note that I’m running Arch, so my instructions will be directed to it.
And finally, if you are adding a new drive, don’t forget to do it now. I installed the new drive and used a USB-C enclosure to access my old drive.
⚠️ WARNING:We will be using dd to copy the old data. Make sure to select the right partition and more importatnly, the right direction because dd will erase all your data.
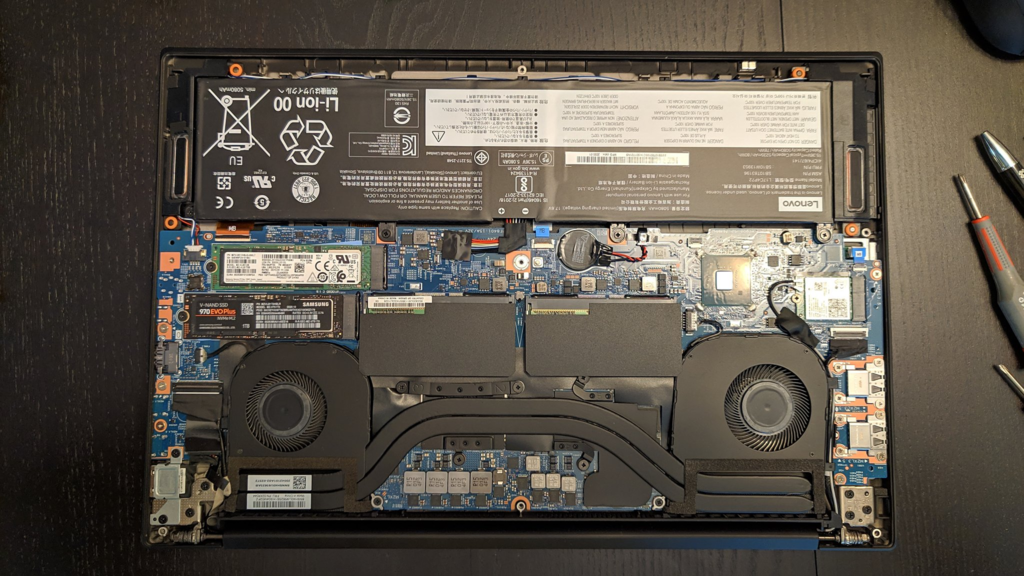
New NVMe installed
Instructions
Creating the LV and Copying the Data
a. Power off the machine and boot into an Arch install ISO
b. Create an EFI and a LVM partition using gdisk (I’m not getting in details on this, but there are plenty of tutorials online). Make sure the EFI partition is the same size as your old one
Here’s my layout. My the new drive shows as /dev/nvme1n1
Device           Start        End    Sectors  Size Type
/dev/nvme1n1p1    2048    1050623    1048576  512M EFI System
/dev/nvme1n1p2 1050624 1953525134 1952474511  931G Linux LVM
c. Copy the old EFI partition to the new EFI partition with dd (note that my old drive mounted via the USB-C enclosure now shows as /dev/sdb)
# dd if=/dev/sdb1 of=/dev/nvme1n1p1 bs=4M
d. Create the PV/VG
# vgcreate root_vg /dev/nvme1n1p2
e. Create the logical volumes. Make sure that they have the same size as the old partitions
We now need to fix our EFI and GRUB to make sure we can boot into our LV partition.
a. Mount root
# mkdir /mnt/root

# mount /dev/root_vg/root /mnt/root
b. Enter chroot of our copied data
# arch-chroot /mnt/root
c. Mount our EFI partition
# mount /dev/nvme1n1p1 /efi
d. Fix fstab for the swap partition (because we did not copy our swap partition, a new UUID was generated. We need to change /etc/fstab with that new partition UUID)
h. Enable the LVM module for GRUB by editing /etc/default/grub and adding the lvm module to GRUB_PRELOAD_MODULES
# Preload both GPT and MBR modules so that they are not missed
GRUB_PRELOAD_MODULES="part_gpt part_msdos lvm"
i. Re-create GRUB config
# grub-mkconfig -o /boot/grub/grub.cfg
j. Unmount /efi
# umount /efi
k. Exit chroot
# exit
l. Unmount root
# umount /mnt/root
m. Power off, remove the old drive and the Arch iso and reboot
# poweroff
If everything was done correctly you should be able to boot your system normally. If something is not working don’t panic. Your data should be safe and sound on your old drive. Review your steps, do additional research for anything specific to your configuration and try again.
This blog post is essentially my study notes for the RHCSA v8 exam on Logical Volume Manager. It should be taken as a quick reference document (or a cheat sheet of some sorts).
It covers the following exam subjects:
Configure local storage
Create and remove physical volumes
Assign physical volumes to volume groups
Create and delete logical volumes
Create and configure file systems
Extend existing logical volumes
Note: There could be additional information needed for the exam that is not covered here.
Overview
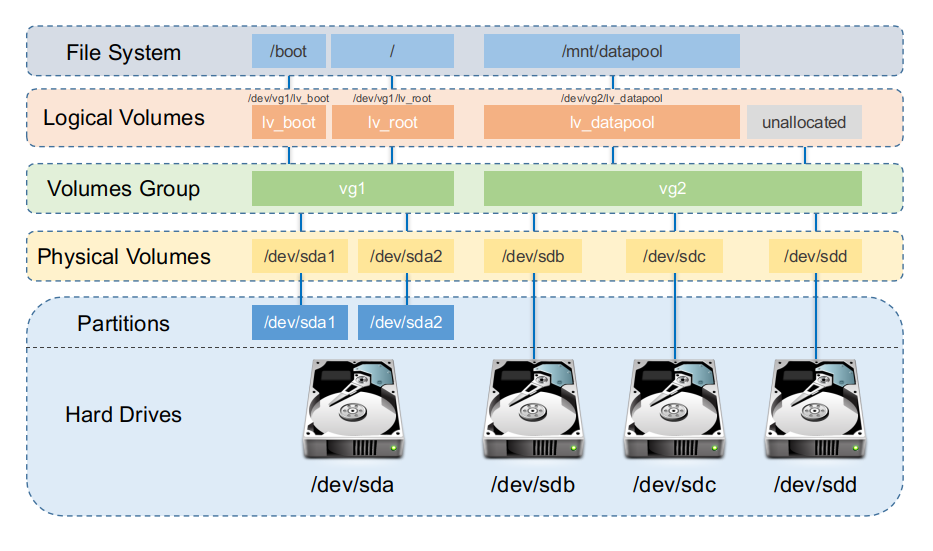
Logical Volume Manager (LVM) is a device mapper target that provides logical volume management for the Linux kernel. LVM allows a pool of space to manage storage.
PV - Physical Volumes are directly related to hard drives or partitions
VG - A Volume Group can have multiple physical Volumes
LV - A Logical Volume sits inside a Volume Group and it’s what is assigned to a file system.
The filesystem sits on top of the logical volume and it will be formatted to a specifc fs type (vfat, xfs, ext4) and mounted (/root, /home, /mnt/*, etc).
When a physical disk is setup for LVM, metadata is written at the beginning of the disk for normal usage, and at the end of the disk for backup usage.
Overview of Creating a Physical Volume
First create initialize the disks to be used by LVM with pvcreate (Initialize physical volume(s) for use by LVM)
# pvcreate /dev/device /dev/device2 /dev/device3
Then we create a volume group with vgcreate (Create a volume group)
Optionally use the -s switch to set the Physical Extent size (for LVM2, the only effect this flag has is that when using too many physical volumes, the LVM tools will perform better)
Create the Logical Volume (4GB)
# lvcreate -L 4g [vg name] -n [lv name]
Flags:
-n - set the Logical Volume name
-l - use extents rather than a specified size
And finally create the file system
# mkfs.xfs /dev/[vgname]/[lvname]
Working With LVM
Physical Volumes
Commands reference:
lvm (8) - LVM2 tools
pvcreate (8) - Initialize physical volume(s) for use by LVM
pvdisplay (8) - Display various attributes of physical volume(s)
pvremove (8) - Remove LVM label(s) from physical volume(s)
pvs (8) - Display information about physical volumes
Creating Physical Volumes
Physical volumes can be created using full disks or partitions.
# pvcreate /dev/part1 /dev/part2
Or
# pvcreate /dev/sdb /dev/sdc
Deleting Physical Volumes
pvremove wipes the label on a device so that LVM will no longer recognize it as a PV. A PV cannot be removed from a VG while it is used by an active LV.
Removing a PV
# pvremove /dev/sdb /dev/sdc
  Labels on physical volume "/dev/sdb" successfully wiped.
  Labels on physical volume "/dev/sdc" successfully wiped.
Trying to remove a PV that has a VG and LV
# pvremove /dev/sdb /dev/sdc
  PV /dev/sdb is used by VG testvg so please use vgreduce first.
  (If you are certain you need pvremove, then confirm by using --force twice.)
  /dev/sdb: physical volume label not removed.
  PV /dev/sdc is used by VG testvg so please use vgreduce first.
  (If you are certain you need pvremove, then confirm by using --force twice.)
  /dev/sdc: physical volume label not removed.
You can try to force remove with -ff
# pvremove -ff /dev/sdb /dev/sdc
  WARNING: PV /dev/sdb is used by VG testvg.
Really WIPE LABELS from physical volume "/dev/sdb" of volume group "testvg" [y/n]? y
  WARNING: Wiping physical volume label from /dev/sdb of volume group "testvg".
  WARNING: PV /dev/sdc is used by VG testvg.
  Really WIPE LABELS from physical volume "/dev/sdc" of volume group "testvg" [y/n]? y
  WARNING: Wiping physical volume label from /dev/sdc of volume group "testvg".
Volume Groups
Commands reference:
lvm (8) - LVM2 tools
vgcreate (8) - Create a volume group
vgdisplay (8) - Display volume group information
vgextend (8) - Add physical volumes to a volume group
vgreduce (8) - Remove physical volume(s) from a volume group
vgremove (8) - Remove volume group(s)
vgs (8) - Display information about volume groups
Creating a Volume Group
vgcreate creates a new VG on block devices. If the devices were not previously intialized as PVs with pvcreate, vgcreate will inititialize them, making them PVs. The pvcreate options for initializing devices are also available with vgcreate.
# vgdisplay vg1
  --- Volume group ---
  VG Name               vg1
  System ID
  Format                lvm2
  Metadata Areas        2
  Metadata Sequence No  1
  VG Access             read/write
  VG Status             resizable
  MAX LV                0
  Cur LV                0
  Open LV               0
  Max PV                0
  Cur PV                2
  Act PV                2
  VG Size               5.99 GiB
  PE Size               4.00 MiB
  Total PE              1534
  Alloc PE / Size       0 / 0
  Free  PE / Size       1534 / 5.99 GiB
  VG UUID               uvHpRZ-BdPH-Nzxy-Lp15-VMps-fzPZ-A1bebc
You can also create a PV with vgcreate (bypassing the need to run pvcreate)
# vgcreate vg2 /dev/sdd
  Physical volume "/dev/sdd" successfully created.
  Volume group "vg2" successfully created
Extending a Volume Group
You can use vgextend to extend volume groups by adding physical volumes to it.
Initialize the new drive as a physical volume with pvcreate
# lvdisplay vg1
  --- Logical volume ---
  LV Path                /dev/vg1/lv1
  LV Name                lv1
  VG Name                vg1
  LV UUID                ADUPcG-YAuo-5vDC-7FEB-Cas9-4Gt0-hR1kVD
  LV Write Access        read/write
  LV Creation host, time localhost.localdomain, 2020-11-18 08:07:29 -0500
  LV Status              available
  # open                 0
  LV Size                4.00 GiB
  Current LE             1024
  Segments               2
  Allocation             inherit
  Read ahead sectors     auto
  - currently set to     8192
  Block device           253:2
Extending a Logical Volume
lvextend adds space to a logical volume. The space needs to be available in the volume group.
When extending Logical Volumes, you do not need to unmount the partition (however you will need to extend the file system afterwards, or if the filesystems supports, use the ‘-r’ flag to automatically resize the filesystem).
Checking for available space
Use vgs to see the available space of the volume group
# vgs vg1
  VG  #PV #LV #SN Attr   VSize  VFree
  vg1   3   1   0 wz--n- <8.99g <4.99g
                           |      |- Available VG space (not allocated to a LV)
                           |- Total size of VG
You can use lvs to confirm that the LV is using the difference of the previous values
# lvextend -L6G /dev/vg1/lv1
  Size of logical volume vg1/lv1 changed from 5.39 GiB (1381 extents) to 6.00 GiB (1536 extents).
  Logical volume vg1/lv1 successfully resized.
Extend the volume by 1GB
# lvextend -L+1G /dev/vg1/lv1
  Size of logical volume vg1/lv1 changed from 6.00 GiB (1536 extents) to 7.00 GiB (1792 extents).
  Logical volume vg1/lv1 successfully resized.
Extend for the full available space in the VG
# lvextend -l +100%FREE /dev/vg1/lv1
  Size of logical volume vg1/lv1 changed from 7.00 GiB (1792 extents) to <8.99 GiB (2301 extents).
  Logical volume vg1/lv1 successfully resized.
Note that lvextend -l 100%FREE /dev/vg1/lv1 (without the plus size) will not work
Extend to the percentage of the VG (60% or 8.99 = 5.394)
# lvextend -l 60%VG /dev/vg1/lv1
  Size of logical volume vg1/lv1 changed from 4.00 GiB (1024 extents) to 5.39 GiB (1381 extents).
  Logical volume vg1/lv1 successfully resized.
You can also use the ‘PE’ size
# lvextend -l +1740 /dev/RHCSA/pinehead
  Size of logical volume RHCSA/pinehead changed from <3.20 GiB (818 extents) to 9.99 GiB (2558 extents).
  Logical volume RHCSA/pinehead successfully resized.
Shrinking a Logical Volume
Be careful when reducing an LV’s size, because data in the reduced area is lost. Ensure that any file system on the LV is resized before running lvreduce so that the removed extents are not in use by the file system.
You can use two commands to shrink a logical volume:
lvreduce reduces the size of an LV. The freed logical extents are returned to the VG to be used by other LVs.
lvresize resizes an LV in the same way as lvextend and lvreduce.
Shrink a logical volume by 2GB
# lvresize -L-2G /dev/vg1/lv1
  WARNING: Reducing active logical volume to <6.99 GiB.
  THIS MAY DESTROY YOUR DATA (filesystem etc.)
Do you really want to reduce vg1/lv1? [y/n]: y
  Size of logical volume vg1/lv1 changed from <8.99 GiB (2301 extents) to <6.99 GiB (1789 extents).
  Logical volume vg1/lv1 successfully resized.
Shrink a logical volume to 30% of the volume group size
# lvreduce -l 30%VG  /dev/vg1/lv1
  WARNING: Reducing active logical volume to <2.70 GiB.
  THIS MAY DESTROY YOUR DATA (filesystem etc.)
Do you really want to reduce vg1/lv1? [y/n]: y
  Size of logical volume vg1/lv1 changed from <6.99 GiB (1789 extents) to <2.70 GiB (691 extents).
  Logical volume vg1/lv1 successfully resized.
Deleting/Removing a Logical Volume
lvremove removes one or more LVs. For standard LVs, this returns the logical extents that were used by the LV to the VG for use by other LVs.
# lvremove /dev/vg1/lv1
Do you really want to remove active logical volume vg1/lv1? [y/n]: y
  Logical volume "lv1" successfully removed
For quite a while the RHCSA exam has covered topics related to boot targets and the famous root password reset. However, with the introduction of systemd and other related changes this can sometimes become a bit confusing. The methods that were once used for RHEL 6/7 may no longer be available or may not be the ‘official’ way of doing things anymore.
I will try to clear some of the differences so we can have a better understanding of what’s needed for the RHCSAv8 exam.
Interrupt the boot process in order to gain access to a system
Boot Targets
On this section I will cover topics related to the ‘Boot systems into different targets manually’ objective.
Olders SysV
SysV is an older startup mechanism that was used by many Unix-like operating systems. It was replaced by Systemd and it’s no longer used by Red Hat. However, you will sill find commands that references SysV and it’s run levels.
From Red Hat Enterprise Linux 3: Reference Guide
The SysV init runlevel system provides a standard process for controlling which programs init launches or halts when initializing a runlevel. SysV init was chosen because it is easier to use and more flexible than the traditional BSD-style init process.
The following runlevels are defined by default for Red Hat Enterprise Linux:
0 — Halt
1 — Single-user text mode
2 — Not used (user-definable)
3 — Full multi-user text mode
4 — Not used (user-definable)
5 — Full multi-user graphical mode (with an X-based login screen)
6 — Reboot
SysV Commands
You can find what runlevel the system currently is by executing the command runlevel
# runlevel
N 5
And you can change the system runlevel by running telinit with a runlevel number (0-6)
# telini 6
📝 NOTE:You should not be using SysV commands to change the runlevels. You should use systemd commands instead.
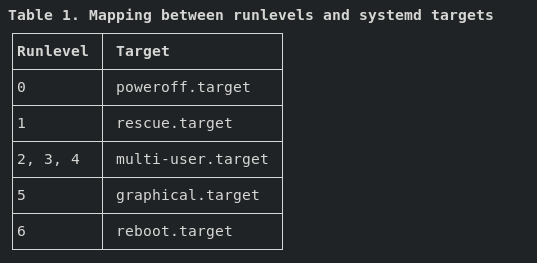
Systemd targets are similar to SysV runlevels, and they are what you should use/reference from now on (including for the RHCSAv8 exam).
From Arch Wiki
systemd uses targets to group units together via dependencies and as standardized synchronization points. They serve a similar purpose as runlevels but act a little differently. Each target is named instead of numbered and is intended to serve a specific purpose with the possibility of having multiple ones active at the same time.
Runlevels and Systemd
While runlevels are not used anymore, they are still referenced (by older codes and such). Systemd provides a compatibility layer to it’s targets.
From runlevel man page
“Runlevels” are an obsolete way to start and stop groups of services used in SysV init. systemd
provides a compatibility layer that maps runlevels to targets, and associated binaries like
runlevel. Nevertheless, only one runlevel can be “active” at a given time, while systemd can
activate multiple targets concurrently, so the mapping to runlevels is confusing and only
approximate. Runlevels should not be used in new code, and are mostly useful as a shorthand way
to refer the matching systemd targets in kernel boot parameters.
Working with Systemd Targets
Let’s go through the commands that will allow us to list, view and change the Systemd targets.
Listing the available targets
# systemctl list-units --type=target

UNIT                   LOAD   ACTIVE SUB    DESCRIPTION
basic.target           loaded active active Basic System
cryptsetup.target      loaded active active Local Encrypted Volumes
getty.target           loaded active active Login Prompts
graphical.target       loaded active active Graphical Interface
local-fs-pre.target    loaded active active Local File Systems (Pre)
local-fs.target        loaded active active Local File Systems
multi-user.target      loaded active active Multi-User System
network-online.target  loaded active active Network is Online
network-pre.target     loaded active active Network (Pre)
network.target         loaded active active Network
nfs-client.target      loaded active active NFS client services
nss-user-lookup.target loaded active active User and Group Name Lookups
paths.target           loaded active active Paths
remote-fs-pre.target   loaded active active Remote File Systems (Pre)
remote-fs.target       loaded active active Remote File Systems
rpc_pipefs.target      loaded active active rpc_pipefs.target
rpcbind.target         loaded active active RPC Port Mapper
slices.target          loaded active active Slices
sockets.target         loaded active active Sockets
sound.target           loaded active active Sound Card
sshd-keygen.target     loaded active active sshd-keygen.target
swap.target            loaded active active Swap
sysinit.target         loaded active active System Initialization
timers.target          loaded active active Timers
Get the current target
# systemctl get-default
graphical.target
Set the Systemd target for next boot
# systemctl set-default [target]
Change the Systemd target without reboot
# systemctl isolate [target]
Change into rescue/emergency mode
Note: This is related to the next session where we will cover rescue modes.
# systemctl isolate [rescue|emergency]

or

# systemctl [rescue|emergency]
Rescue Modes
This section is related to the ‘Interrupt the boot process in order to gain access to a system’ objective.
Rescue and emergency modes allow you to boot the OS with very few services running and perform administrative tasks to attempt to resolve/repair/recover the system.
There are different types of rescue and emergency modes:
Rescue mode provides a convenient single-user environment and allows you to repair your system in situations when it is unable to complete a regular booting process. In rescue mode, the system attempts to mount all local file systems and start some important system services, but it does not activate network interfaces or allow more users to be logged into the system at the same time.
Note: Equivalent to the old single user mode, where some services are started and every disk is mounted.
Boot Parameter:
Legacy: rescue
Systemd: systemd.unit=rescue.target
Summary:
Requires root password to enter this mode
Mounts all local filesystems (RW)
No network
Starts important services
Single-user mode
Instructions
a. At boot, hit e to edit the boot parameters
b. Add one of the boot parameters at the end of the line that starts with linux
Emergency mode provides the most minimal environment possible and allows you to repair your system even in situations when the system is unable to enter rescue mode. In emergency mode, the system mounts the root file system in read only mode, does not attempt to mount any other local file systems, does not activate network interfaces, and only starts a few essential services.
Boot Parameter:
Legacy: emergency
Systemd: systemd.unit=emergency.target
Summary:
Requires root password to enter this mode
Mounts the root filesystem only (RO)
No network
Only essential services are started
The system does not load any init scripts
Multi-user mode
Instructions
a. At boot, hit e to edit the boot parameters
b. Add one of the boot parameters at the end of the line that starts with linux
c. Press ‘Ctrl + x’ to start
rd.break
Breaks to an interactive shell while in the ‘initrd’ allowing interaction before the system disk is mounted. The main ‘/’ is available under ‘/sysroot’. Useful if you forgot root’s password.
Boot Parameter:
rd.break
Instructions
a. At boot, hit e to edit the boot parameters
b. Add rd.break option at the end of the line that starts with linux
The installation program’s rescue mode is a minimal Linux environment that can be booted from the Red Hat Enterprise Linux DVD or other boot media. It contains command-line utilities for repairing a wide variety of issues. Rescue mode can be accessed from the Troubleshooting menu of the boot menu. In this mode, you can mount file systems as read-only, blacklist or add a driver provided on a driver disc, install or upgrade system packages, or manage partitions.
Instructions
a. Boot the system from either minimal boot media, or a full installation DVD or USB drive, and wait for the boot menu to be displayed.
b. From the boot menu, either select Troubleshooting > Rescue a Red Hat Enterprise Linux system option, or append the inst.rescue option to the boot command line. To enter the boot command line, press the Tab key on BIOS-based systems or the e key on UEFI-based systems.
I will now cover different methods on how to change the root password if you forgot it. This is a common question for the RHCSA exams (or so I’ve heard as I have yet to take mine).
Method 1: Fixing SELinux context before reboot
This is not the “official” method, but it’s the one I like the most. It saves a bit of time from having to relabel the whole system for SELinux context.
a. Boot into rd.break mode
b. Re-mount sysroot in RW
switch_root:/# mount -o rw,remount /sysroot
c. Chroot into sysroot
switch_root:/# chroot /sysroot
d. Change the password for root
sh-4.4# passwd
e. Load the SELinux policies
sh-4.4# load_policy -i
f. Fix the policy for /etc/shadow
sh-4.4# restorecon -v /etc/shadow
g. Exit chroot
sh-4.4# exit
h. Remount as RO
switch_root:/# mount -o ro,remount /sysroot
i. Reboot
switch_root:/# reboot
Method 2: Setting autorelabel on reboot
This is the most common method that you will find online for the RHCSA exam. It’s also the method shown in Red Hat’s official documentation for RHEL 8.
a. Boot into rd.break mode
b. Re-mount sysroot in RW
switch_root:/# mount -o rw,remount /sysroot
c. Chroot into sysroot
switch_root:/# chroot /sysroot
d. Change the password for root
sh-4.4# passwd
e. Force the relabel of SELinux context for the filesystem
sh-4.4# touch /.autorelabel
f. Exit chroot
sh-4.4# exit
g. Remount as RO
switch_root:/# mount -o ro,remount /sysroot
h. Reboot
switch_root:/# reboot
Note: It takes a while for the system to relabel all the files with SELinux context.
Method 3: Setting SELinux to permissive and manually fixing the context
With this method we temporarily set SELinux to permissive mode, make our password changes, reload the SELinux context for the shadow file, and then re-enable SELinux.
⚠️ WARNING:While this initially worked for me on RHEL 8 (you will get a lot of SELinux errors, which is expected), after a while my VM would hang and I could no longer login as any user or restart it.
a. Boot into rd.break mode by adding rd.break enforcing=0 to the boot line
b. Re-mount sysroot in RW
switch_root:/# mount -o rw,remount /sysroot
c. Chroot into sysroot
switch_root:/# chroot /sysroot
d. Change the password for root
sh-4.4# passwd
e. Exit chroot
sh-4.4# exit
f. Remount as RO
switch_root:/# mount -o ro,remount /sysroot
g. Exit switch_root and wait for the system to finish booting
switch_root:/# exit
h. As root, fix SELinux context for /etc/shadow
[root@localhost ~]# restorecon -v /etc/shadow
i. Set SELinux to enforcing mode
[root@localhost ~]# setenforce 1
Method 4: Disabling SELinux and manually fixing the context
This is very similar to method 3, however we are completely disabling SELinux.
⚠️ WARNING:This method did not work for me. My VM did not finish booting after making the changes.
a. Boot into rd.break mode by adding rd.break selinux=0 to the boot line
b. Re-mount sysroot in RW
switch_root:/# mount -o rw,remount /sysroot
c. Chroot into sysroot
switch_root:/# chroot /sysroot
d. Change the password for root
sh-4.4# passwd
e. Exit chroot
sh-4.4# exit
f. Remount as RO
switch_root:/# mount -o ro,remount /sysroot
g. Exit switch_root and wait for the system to finish booting
switch_root:/# exit
h. As root, fix SELinux context for /etc/shadow
[root@localhost ~]# restorecon -v /etc/shadow
i. Re-enable SELinux
[root@localhost ~]# setenforce 1
Conclusion
I hope I helped you make a bit more sense from all of the different options and info around this topic. If you have any comments, corrections or addition, please leave them below. I would love to hear from you.
As mentioned on previous posts, I have spent the past few weeks dealing with a ZFS crash on my FreeNAS install. Because of that, not only was I forced to learn how to troubleshoot ZFS, but I also had to learn how to setup new volumes and come up with new backup strategies (between a few other things).
This was a great opportunity for me to learn more about ZFS (because I new ‘nada’ to start with). And I’m happy to share some of the knowledge that I gathered with you on this post.
Please keep in mind that I don’t consider myself an expert on ZFS (not even close), but I will try to make things simple and easy to understand for someone, who like me, is just getting started with ZFS.
About ZFS
What is ZFS and It’s History
ZFS is a local filesystem (i.e.: ext4, NTFS, exfat) and logical volume manager (i.e.: LVM on Linux) created by Sun Microsystems. ZFS was published under an open source license until Oracle bought Sun Microsystems and closed source the license. Because the source code was already in the open and ported to different OSs, eventually a project called ‘OpenZFS’ was created, and that is the core code that is used on most Unix like systems today (Linux, FreeBSD, etc.).
ZFS Components
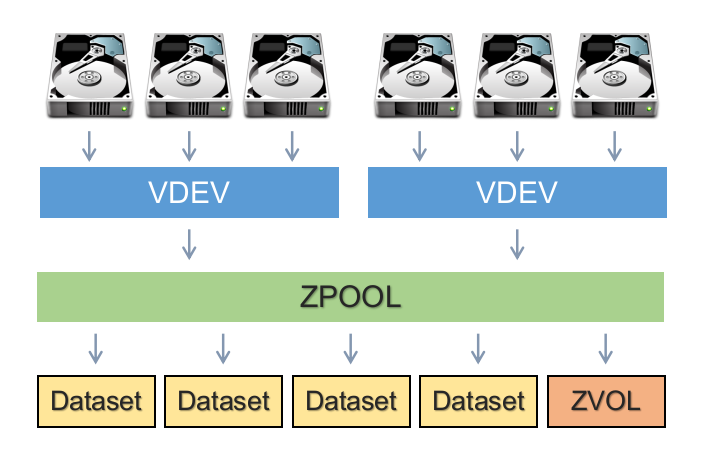
vdev
A vdev is composed of one or more physical drives (can also be of things other than hard drive, like files). They can be combined together in mirrors or RAIDZs.
💡 TIP: There are 7 different types of vdevs, and some of them (like host spare, L2ARC and ZIL) are very important.
Pool
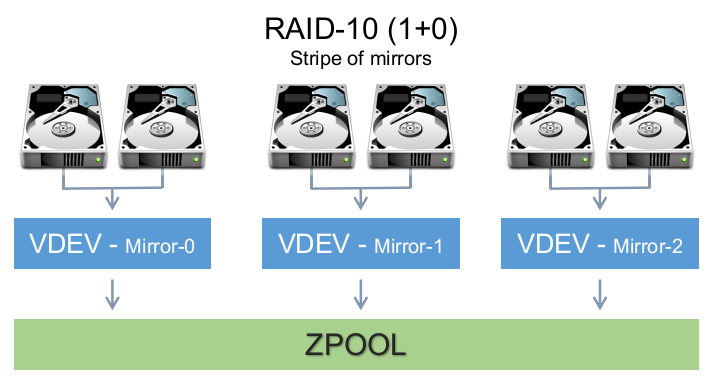
A pool is composed of one or more vdevs and they usually contain a volume or a dataset (which you create after creating the pool). You create/define your vdevs when you create a pool (with the zpool command which we’ll see later). This allows you to mix vdev types together to achieve other RAIDZ levels (see example below):
Datasets
Dataset is the filesystem part of ZFS (so far we’ve seen the LVM components). Here you can define user access, quotas, compression, snapshots, etc…
Volume
Volume is the brother of datasets but in a block device representation. It provides some of the features that datasets have, but not all. Volumes can be useful to run other filesystems on top of ZFS, or to export iSCSI extents.
RAIDZ Types
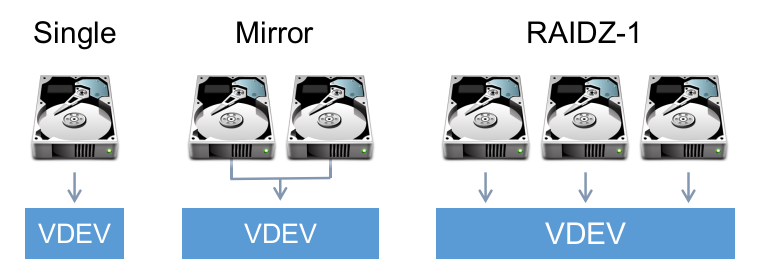
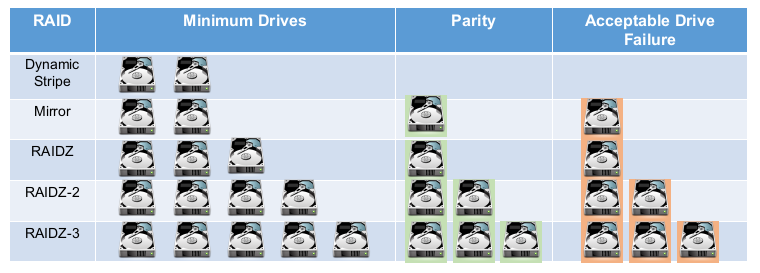
Dynamic/Simple Stripe (RAID0) - Distributes data without parity. Loosing a device means loosing all data
MIRROR (RAID1) - Mirrored drives. Used with 2 to 4 disks (or more)
RAIDZ-1 (RAID5) - Distributes parity along with the data and can lose one physical drive before a raid failure. RAIDZ requires at least 3 disks
RAIDZ-2 (RAID6) - Distributes parity along with the data and can lose up to 2 physical drives. RAIDZ-2 requires at least 4 disks
RAIDZ-3 - Distributes parity along with the data and can lose up to 3 physical drives. RAIDZ-3 requires at least 4, but should be used with no less than 5 disks
Commands
Let’s take a look at the most common commands for handling ZFS pools and filesystem. We’ll use /dev/sdx to refer to device names, but keep in mind that using the device UUID is preferred in order to avoid boot issues due to device name changes.
1.ZFS Pool Commands
These are the commands related to creating vdevs and pools. We will be looking at:
zpool create - Create a pool (and vdevs)
zpool status - Displays pool status
zpool list - List pool and it’s details
zpool history - Shows history of commands for zpool
zpool import- Imports and mounts pool
zpool export - Exports and unmounts pool
zpool destroy - Destroy pool and all filesystems
zpool scrub - Starts scrub of pool
1.1.Creating a Pool (and vdevs)
To create a new pool we use the zpool create command. We specify the pool name and the device we want to use.
It’s basic usage is:
# zpool create [pool] [devices]
Now let’s look at different examples for this command.
Create a pool on a single disk
The command below creates a pool on a single disk.
# zpool create tank /dev/sdb
Create a dynamic stripe pool on 3 disks
Remember that dynamic stripe is the same as RAID0 and that it has no parity.
# zpool create tank /dev/sdb /dev/sdc /dev/sdd
We can view the new pool with zpool status
root@ubuntu-vm:~# zpool status
  pool: tank
 state: ONLINE
  scan: none requested
config:

	NAME        STATE     READ WRITE CKSUM
	tank        ONLINE       0     0     0
	  sdb       ONLINE       0     0     0
	  sdc       ONLINE       0     0     0
	  sdd       ONLINE       0     0     0

errors: No known data errors
Note that the pool name is ‘tank’ and the vdevs are ‘sdb’, ‘sdc’ and ‘sdd’
Create a mirrorred pool on 2 disks
# zpool create tank mirror sdb sdc
Note that I can omit /dev and give the device name. Let’s view the result.
# zpool status
  pool: tank
 state: ONLINE
  scan: none requested
config:

	NAME        STATE     READ WRITE CKSUM
	tank        ONLINE       0     0     0
	  mirror-0  ONLINE       0     0     0
	    sdb     ONLINE       0     0     0
	    sdc     ONLINE       0     0     0

errors: No known data errors
Our vdev is ‘mirror-0’ and our pool is tank.
Create a RAID-Z pool
# zpool create tank raidz sdb sdc sdd
And the result indicating that my vdev is RAIDZ1.
root@ubuntu-vm:~# zpool status
  pool: tank
 state: ONLINE
  scan: none requested
config:

	NAME        STATE     READ WRITE CKSUM
	tank        ONLINE       0     0     0
	  raidz1-0  ONLINE       0     0     0
	    sdb     ONLINE       0     0     0
	    sdc     ONLINE       0     0     0
	    sdd     ONLINE       0     0     0

errors: No known data errors
You can use the same command to create RAIDZ2,3 pools.
# zpool create [pool name] raidz[1,2,3] [devices]
Specifying a default mount point for the pool
You can also specify the default mount point for the pool by using the -m flag as you create it.
# zpool create tank -m /mnt/tank mirror sdb sdc
We can see that our new pool was created and mounted at /mnt/tank
# zfs list
NAME   USED  AVAIL     REFER  MOUNTPOINT
tank    99K  4.36G       24K  /mnt/tank
💡 TIP: Also read up on the zpool add command.
1.2.Getting Pool Status
After we create a new pool it’s automatically imported into our system. As we have seen before, we can view details of the pool with the zpool status command.
# zpool status tank
  pool: tank
 state: ONLINE
  scan: none requested
config:

	NAME        STATE     READ WRITE CKSUM
	tank        ONLINE       0     0     0
	  mirror-0  ONLINE       0     0     0
	    sdb     ONLINE       0     0     0
	    sdc     ONLINE       0     0     0

errors: No known data errors
Some of the fields we did not look before are:
state: Indicates if pool is online or not
status: Additional information about the pool
action: Indicates if there are any pending actions for the pool
scan: If a scrub is in progress or the last scrub run status
errors: Indicates if there are any problems with the pool
For example:
# zpool status tank
  pool: tank
 state: ONLINE
status: Some supported features are not enabled on the pool. The pool can
        still be used, but some features are unavailable.
action: Enable all features using 'zpool upgrade'. Once this is done,
        the pool may no longer be accessible by software that does not support
        the features. See zpool-features(7) for details.
  scan: scrub repaired 0 in 0 days 03:37:12 with 0 errors on Wed Oct 28 03:37:13 2020
config:

	NAME        STATE     READ WRITE CKSUM
	tank        ONLINE       0     0     0
	  mirror-0  ONLINE       0     0     0
	    sdb     ONLINE       0     0     0
	    sdc     ONLINE       0     0     0

errors: No known data errors
Another example:
# zpool status -v tank
  pool: tank
 state: ONLINE
status: One or more devices has experienced an error resulting in data
    corruption.  Applications may be affected.
action: Restore the file in question if possible.  Otherwise restore the
    entire pool from backup.
   see: http://illumos.org/msg/ZFS-8000-8A
  scan: scrub repaired 0 in 0 days 04:21:43 with 0 errors on Sun Feb 23 04:21:45 2020
config:

	NAME        STATE     READ WRITE CKSUM
	tank        ONLINE       0     0     0
	  mirror-0  ONLINE       0     0     0
	    sdb     ONLINE       0     0     0
	    sdc     ONLINE       0     0     0

errors: Permanent errors have been detected in the following files:

        tank:<0xdcca>
1.3.Listing Pools
As we have seen before, we can view some details of the pool with the zpool status command. But there are other commands, like zpool list that can give us information about the pool.
# zpool list {pool name}
On the example below, we look at the details for our mirrored tank pool:
# zpool list
NAME   SIZE  ALLOC   FREE  CKPOINT  EXPANDSZ   FRAG    CAP  DEDUP    HEALTH  ALTROOT
tank  4.50G   117K  4.50G        -         -     0%     0%  1.00x    ONLINE  -
1.4.Show Pool History
This is another useful command that displays the history of commands that were executed against a pool from it’s creation (of course only commands that make changes to the pool’s configuration).
# zpool history tank
History for 'tank':
2020-11-02.15:02:53 zpool create tank -m /mnt/tank mirror sdb sdc
2020-11-02.15:50:43 zpool scrub tank
2020-11-02.15:53:30 zfs set compression=lz4 tank
2020-11-02.15:54:03 zpool scrub tank
1.5.Importing Pools
Usually after creating a pool it’s set to import and mount automatically, but you may encounter scenarios where you need to manually import a pool (like when troubleshooting or after re-imaging a system).
Note that the import command will also mount the pool.
Lists pools available to import
Running the zpool import command without a pool name will show you a list of pools that can be imported.
Example of when no pools are available to be imported.
root@ubuntu-vm:~# zpool import
no pools available to import
Here we have a pool that can be imported.
root@ubuntu-vm:~# zpool import
   pool: tank
     id: 2008489828128587072
  state: ONLINE
 action: The pool can be imported using its name or numeric identifier.
 config:

	tank        ONLINE
	  mirror-0  ONLINE
	    sdb     ONLINE
	    sdc     ONLINE
Importing the pool
Give the command a pool name and it will be imported.
root@ubuntu-vm:~# zpool import tank

root@ubuntu-vm:~# zpool list
NAME   SIZE  ALLOC   FREE  CKPOINT  EXPANDSZ   FRAG    CAP  DEDUP    HEALTH  ALTROOT
tank  4.50G   147K  4.50G        -         -     0%     0%  1.00x    ONLINE  -
You can also import all available pools by using the -a option.
# zpool import -a
Importing a Pool with an Alternate Root Location
Use the -R flag to mount the pool to an alternate root location. Note that this is not the mount path for the pool, but an alternate root folder.
tank is by default configured to be mounted at /mnt/tank
root@ubuntu-vm:~# zpool import -R /mnt/tank2 tank

root@ubuntu-vm:~# zfs list
NAME   USED  AVAIL     REFER  MOUNTPOINT
tank   117K  4.36G       24K  /mnt/tank2/mnt/tank
1.6.Exporting the Pool
As expected, this is the opposite of the import command. The export command attempts to unmount any mounted file systems within the pool before continuing.
# zpool export [pool name]
For example:
root@ubuntu-vm:~# zpool export tank

root@ubuntu-vm:~# zpool list
no pools available
If any of the file systems fail to unmount you can forcefully unmount them by using the -f option. However, if ZFS volumes exist and are in use, even with -f it will fail to export.
1.7.Destroying/Deleting Pools
We can use the zfs destroy command to delete pools and all it’s child datasets and/or volumes.
⚠️ WARNING:This will delete all your data, including any snapshots your may have.
root@ubuntu-vm:~# zpool destroy tank

root@ubuntu-vm:~# zpool list
no pools available

root@ubuntu-vm:~# zpool import
no pools available to import
1.8.Scrubbing Pools
ZFS scrub checks every block in a pool against its known checksum to make sure that the data is valid. If you have vdevs with parity, ZFS scrub will also repair the data using healthy data from other disks. Scrubs should run on a schedule to make sure your systems stays healthy.
Initiating a scrub
Initiating a scrub of a pool is as simple as running:
# zpool scrub [pool]
Checking the status of a scrub
You can check the status of a scrub with zpool status and looking for messages in the ‘scan’ section.
root@ubuntu-vm:/mnt/tank# zpool status tank
  pool: tank
 state: ONLINE
  scan: scrub repaired 0B in 0 days 00:00:03 with 0 errors on Tue Nov  3 16:26:23 2020
config:

	NAME        STATE     READ WRITE CKSUM
	tank        ONLINE       0     0     0
	  mirror-0  ONLINE       0     0     0
	    sdb     ONLINE       0     0     0
	    sdc     ONLINE       0     0     0

errors: No known data errors
Stopping a scrub
Use the -s flag.
# zpool scrub -s [pool]
2.ZFS Filesystem Commands
Now we will look at the commands that will help us work with filesystems (datasets) and volumes. We will concentrate more on the filesystem side of things and will not cover volumes.
The commands we will review are:
zfs create - Creates a new volume or filesystem
zfs mount/umount - Mounts the filesystem
zfs list - Lists datasets and snapshots
zfs get/set - Gets configuration and sets configuration for the dataset
zfs snapshot - Handles snapshots
zfs diff - Used to compare data between snapshot
zfs rollback - Rolls back a snapshot
zfs send/recv - Sends a snapshot as a stream of data
zfs destroy - Deletes datasets and snapshots
2.1. Creating Datasets
We can create datasets with the zfs create command. Here we create ‘dataset1’ as child of the ‘tank’ dataset (that was created automatically with the zpool create command).
root@ubuntu-vm:~# zfs create tank/dataset1

root@ubuntu-vm:~# zfs list
NAME            USED  AVAIL     REFER  MOUNTPOINT
tank            145K  9.36G     30.6K  /tank
tank/dataset1  30.6K  9.36G     30.6K  /tank/dataset1
Creating missing parent datasets
We can also create missing parent datasets with the -p flag (similar to mkdir -p).
root@ubuntu-vm:~# zfs create tank/dataset1/childset1/childset2
cannot create 'tank/dataset1/childset1/childset2': parent does not exist

root@ubuntu-vm:~# zfs create -p tank/dataset1/childset1/childset2

root@ubuntu-vm:~# zfs list
NAME                                USED  AVAIL     REFER  MOUNTPOINT
tank                                249K  9.36G     30.6K  /tank
tank/dataset1                      30.6K  9.36G     30.6K  /tank/dataset1
tank/dataset1/childset1            61.3K  9.36G     30.6K  /tank/dataset1/childset1
tank/dataset1/childset1/childset2  30.6K  9.36G     30.6K  /tank/dataset1/childset1/childset2
2.2. Mounting Filesystems (Datasets)
We can use the zfs mount/unmount commands to view the current mount points as well as mounting/unmounting filesystems.
Viewing current mounted filesystems
Without any arguments, zfs mount will display all mounted zfs filesystems and their respective mount points (without the child datasets).
root@ubuntu-vm:~# zfs mount
tank                            /tank
Mounting filesystems
Use zfs mount [pool|dataset] to mount filesystems. On the example below we use zfs mount to establish that no datasets are mounted, and then we mount the ‘tank’ dataset and confirm that is mounted with zfs mount.
root@ubuntu-vm:~# zfs mount

root@ubuntu-vm:~# zfs mount tank

root@ubuntu-vm:~# zfs mount
tank                            /tank
Use the -a option to mount all filesystems.
Mount a child dataset
You can also mount a child dataset without the parent datasets. For example, here we confirm that ‘tank’ is not mounted, then we look at the available datasets, and we execute the command to mount the tank/dataset2/childset2 dataset only.
root@ubuntu-vm:~# zfs mount

root@ubuntu-vm:~# zfs list
NAME                                USED  AVAIL     REFER  MOUNTPOINT
tank                                249K  9.36G     30.6K  /tank
tank/dataset1                      30.6K  9.36G     30.6K  /tank/dataset1
tank/dataset2                      91.9K  9.36G     30.6K  /tank/dataset2
tank/dataset2/childset2            61.3K  9.36G     30.6K  /tank/dataset2/childset2
tank/dataset2/childset2/childset2  30.6K  9.36G     30.6K  /tank/dataset2/childset2/childset2

root@ubuntu-vm:~# zfs mount tank/dataset2/childset2

root@ubuntu-vm:~# zfs mount
tank/dataset2/childset2         /tank/dataset2/childset2
Note that this will create the required path in the OS filesystem to mount the child dataset. If you decide to mount the parent dataset later you may run into a directory is not empty error because of the created directories.
Unmounting filesystems
Runzfs unmount and specify the dataset name.
root@ubuntu-vm:~# zfs mount
tank                            /tank

root@ubuntu-vm:~# zfs unmount tank

root@ubuntu-vm:~# zfs mount
2.3. Listing Filesystems (Datasets)
You can list the dataset by running zfs list [dataset name].
root@ubuntu-vm:~# zfs list tank
NAME   USED  AVAIL     REFER  MOUNTPOINT
tank   253K  9.36G     30.6K  /tank
And you can also specify the mount point as an argument.
root@ubuntu-vm:~# zfs list /tank
NAME   USED  AVAIL     REFER  MOUNTPOINT
tank   253K  9.36G     30.6K  /tank
If run without a dataset name, zfs list will show all datasets in the system recursively.
root@ubuntu-vm:~# zfs list
NAME                                USED  AVAIL     REFER  MOUNTPOINT
tank                                253K  9.36G     30.6K  /tank
tank/dataset1                      30.6K  9.36G     30.6K  /tank/dataset1
tank/dataset2                      91.9K  9.36G     30.6K  /tank/dataset2
tank/dataset2/childset2            61.3K  9.36G     30.6K  /tank/dataset2/childset2
tank/dataset2/childset2/childset2  30.6K  9.36G     30.6K  /tank/dataset2/childset2/childset2
💡 TIP: when specifying a dataset name you can also use the -r flag to display the dataset recursively.
2.4. Getting and Setting Dataset Properties
Properties control the behavior of filesystems, volumes, snapshots, and clones. ZFS properties can look similar to mount options.
Getting a list of all the properties for a dataset
# zfs get all [dataset]
Getting the current value for a specific property
root@ubuntu-vm:~# zfs get compression tank
NAME  PROPERTY     VALUE     SOURCE
tank  compression  off       default
Setting a property value
Use the zfs set command.
root@ubuntu-vm:~# zfs set compression=lz4 tank

root@ubuntu-vm:~# zfs get compression tank
NAME  PROPERTY     VALUE     SOURCE
tank  compression  lz4       local
2.5. Creating Snapshots
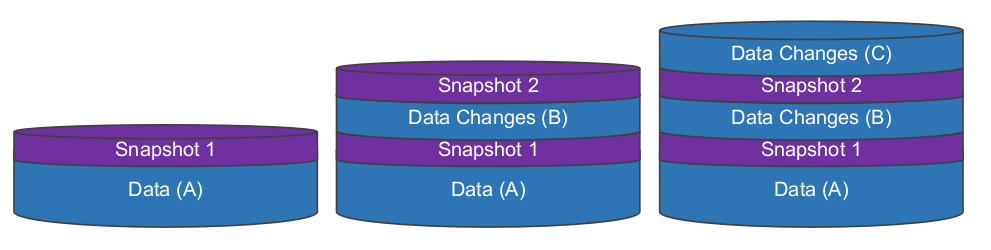
Snapshots allow you to save the state of a filesystem to a current point in time, without duplicating storage (files are not copied). It flags existing data as “read-only” while allowing new data to be added to the filesystem without affecting the existing data blocks that are protected by the snapshot (the whole process is a bit more complicated than this).
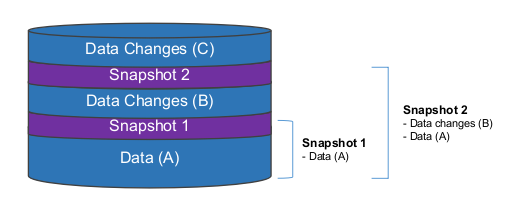
Let’s take a look at the image below as an example. You have a filesystem with existing data (Data A) and you take a snapshot (snapshot 1). Then you make some changes, add new files (Data B) and take another snapshot (snapthot 2). After that you make even more changes (Data C).
Snapshot 1 protects the original data (Data A), while snapshot 2 protects Data Changes (B) as well as the original data (Data A). So you can delete snapshot 1 and data (A) will still be protected.
Note: The amount of data used for the snapshots is very small because we are not copying the files, but instead the filesystem top-level metadata block indicating the they belong to a snapshot.
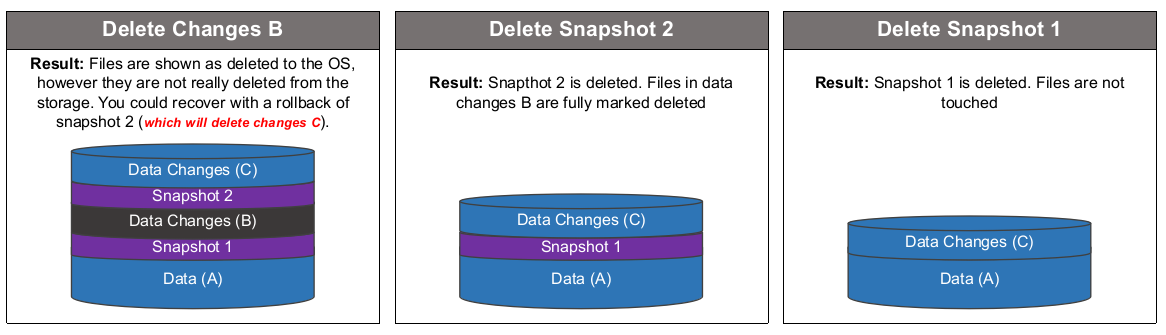
And here are a few scenarios of what happens when you delete files and snapshots:
Snapshots are great for testing software development, or creating a failsafe before an upgrade. But by no means they should be considered (by itself) as a backup or DR solution.
Creating a snapshot
zfs snapshot create [pool/dataset@snapshot_name]
For example:
root@ubuntu-vm:~# zfs snapshot tank/dataset1@snapshot1

root@ubuntu-vm:~# zfs list -t snapshot
NAME                   USED  AVAIL     REFER  MOUNTPOINT
tank/dataset1@snapshot1  17.3K      -     3.00G  -
Creating recursive snapshots
If you have multiple child datasets, you can either create one snapshot of the top-level dataset (usually the pool name), or use the -r flag to create snapshots recursively.
Snapshot of the main dataset:
root@ubuntu-vm:~# zfs snapshot tank@snapshot-master

root@ubuntu-vm:~# zfs list -t snapshot
NAME                   USED  AVAIL     REFER  MOUNTPOINT
tank@snapshot-master     0B      -     30.6K  -
Recursive snapshot:
root@ubuntu-vm:~# zfs snapshot -r tank@recursive

root@ubuntu-vm:~# zfs list -t snapshot
NAME                      USED  AVAIL     REFER  MOUNTPOINT
tank@recursive              0B      -     30.6K  -
tank/dataset1@recursive     0B      -     3.00G  -
Listing snapshots
Use zfs list -t snapshot.
root@ubuntu-vm:~# zfs list -t snapshot
NAME                      USED  AVAIL     REFER  MOUNTPOINT
tank@recursive              0B      -     30.6K  -
tank/dataset1@recursive     0B      -     3.00G  -
Restore a snapshots with zfs rollback. Note that restoring a snapshot will delete all files that were created after the snapshot (as we saw in our example). It will also delete any newer snapshots (you will be asked to use the -r option to rollback and delete newer snapshots).
zfs rollback [pool/dataset@snapshot_name]
2.9. Sending and Receiving Snapshots
One of the best features of ZFS is ‘ZFS send’. It allows you send snapshots as a stream of data. This is a great way replicate a snapshot and it’s dataset to a file, another pool or even to another system via SSH. Amazing no!
Let’s look at the example below. We have 2 pools in our system named ‘tank’ and ‘backup’.
root@ubuntu-vm:~# zpool list
NAME     SIZE  ALLOC   FREE  CKPOINT  EXPANDSZ   FRAG    CAP  DEDUP    HEALTH  ALTROOT
tank       9G  1.50G  7.50G        -         -     0%    16%  1.00x    ONLINE  -
backup  4.50G   104K  4.50G        -         -     0%     0%  1.00x    ONLINE  -
In our tank pool we have a dataset for our Movies.
root@ubuntu-vm:/tank/Movies# zfs list -r tank
NAME          USED  AVAIL     REFER  MOUNTPOINT
tank         1.50G  7.22G       24K  /tank
tank/Movies  1.50G  7.22G     1.50G  /tank/Movies
Before we can send this data we need create a snapshot:
root@ubuntu-vm:~# zfs snapshot tank/Movies@$(date '+%Y-%m-%d_%H-%M')

root@ubuntu-vm:~# zfs list -t snapshot
NAME                           USED  AVAIL     REFER  MOUNTPOINT
tank/Movies@2020-11-03_15-29     0B      -     1.50G  -
And now we can send our snapshot to our backup pool with zfs send/recv.
root@ubuntu-vm:~# zfs list
NAME            USED  AVAIL     REFER  MOUNTPOINT
backup         1.50G  2.86G       24K  /backup
backup/Movies  1.50G  2.86G     1.50G  /backup/Movies
tank           1.50G  7.22G       24K  /tank
tank/Movies    1.50G  7.22G     1.50G  /tank/Movies

root@ubuntu-vm:~# zfs list -t snapshot
NAME                             USED  AVAIL     REFER  MOUNTPOINT
backup/Movies@2020-11-03_15-29     0B      -     1.50G  -
tank/Movies@2020-11-03_15-29       0B      -     1.50G  -
💡 TIP: It’s worth to look into all the options and use cases for ZFS send. Combined with RAIDZs and snapshots, it can help you make your filesystem almost indestructible.
2.10. Destroying Filesystems (Datasets) and Snapshots
Destroying datasets
To destroy a dataset, use zfs destroy (the -r flag also works here).
zfs destroy [pool/dataset]
Destroying snapshots
To destroy a snapshot, also use the zfs destroy command (and the -r flag also works here).
zfs destroy [pool/dataset@snapshot_name]
Conclusion
While we covered a lot of different topics and commands on ZFS, in reality, we really only scratched the surface on what ZFS can do. If you want to learn more about ZFS I’ve added a few links below with some great reading.
For the past few weeks I have been working extensively on the devices in my LAN. My FreeNAS had crashed due to a power outage resulting on a burnt memory module and a data issue with my main pool that caused a kernel panic on boot. My remote backup solution had not been working for over a year, so I knew that it would also need a complete re-design.
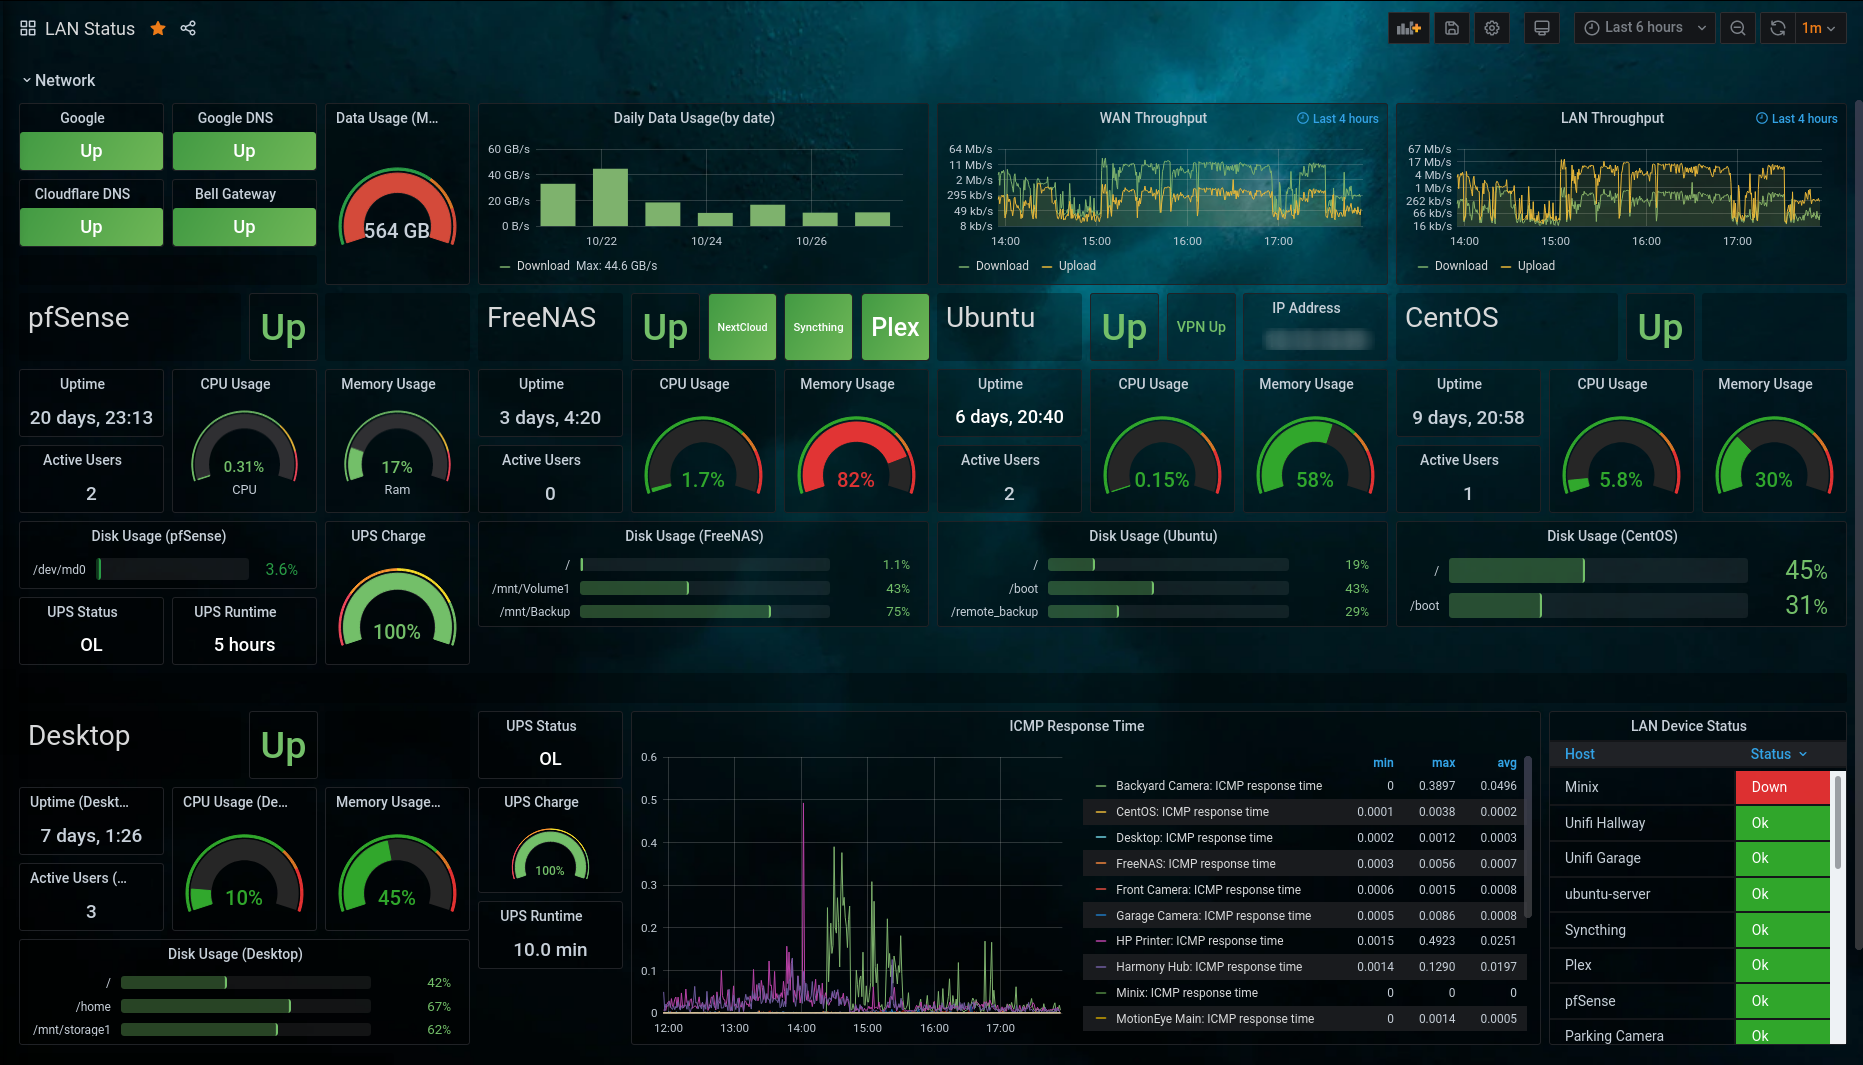
I rebuilt my FreeNAS pools and setup a new remote backup solution using ZFS send (FreeNAS => Ubuntu 20.04), and got a couple of UPSs to protect from future power failures. I also created a better backup structure and jobs for my main devices (will post about that later), and configured additional alerts for device availability and job status. And to tie all down together, I thought what better than to revamp my Grafana dashboard to show all this new info.
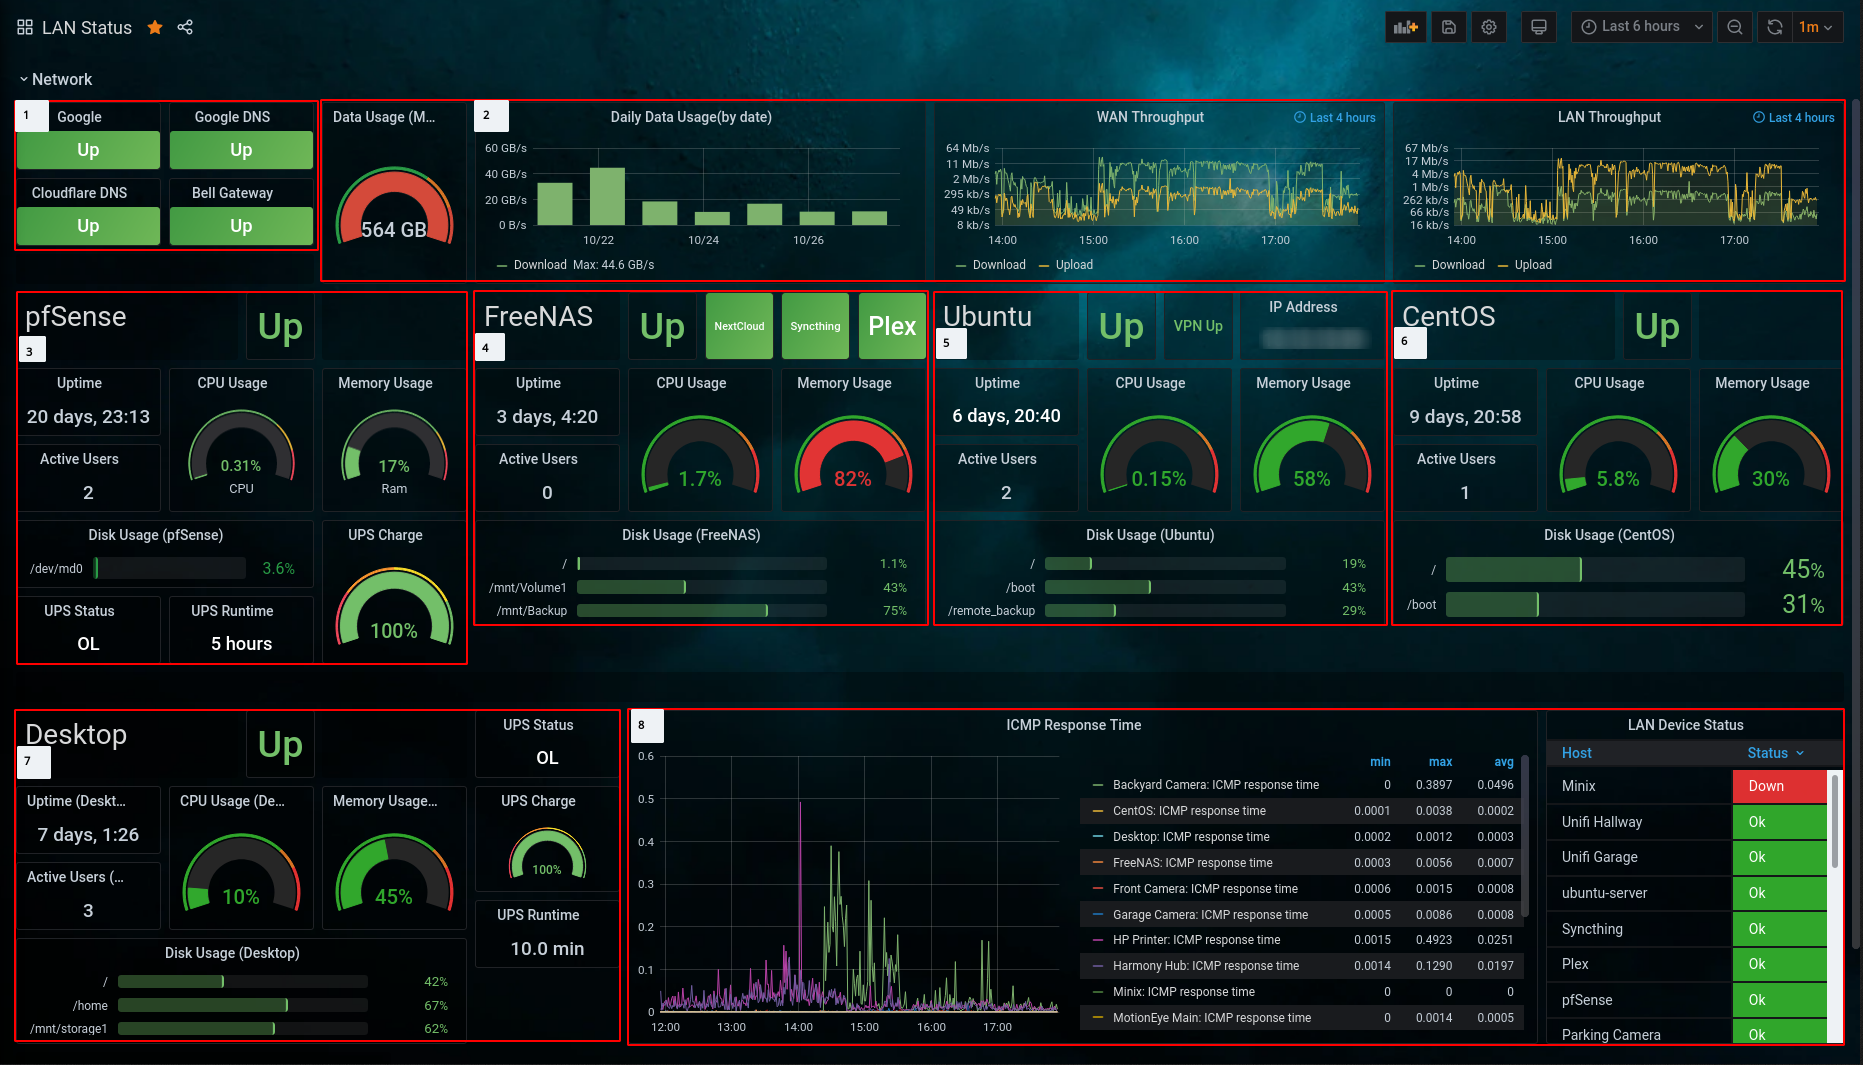
Here’s the final result! I’m quite happy with it.
How Everything is Placed Together
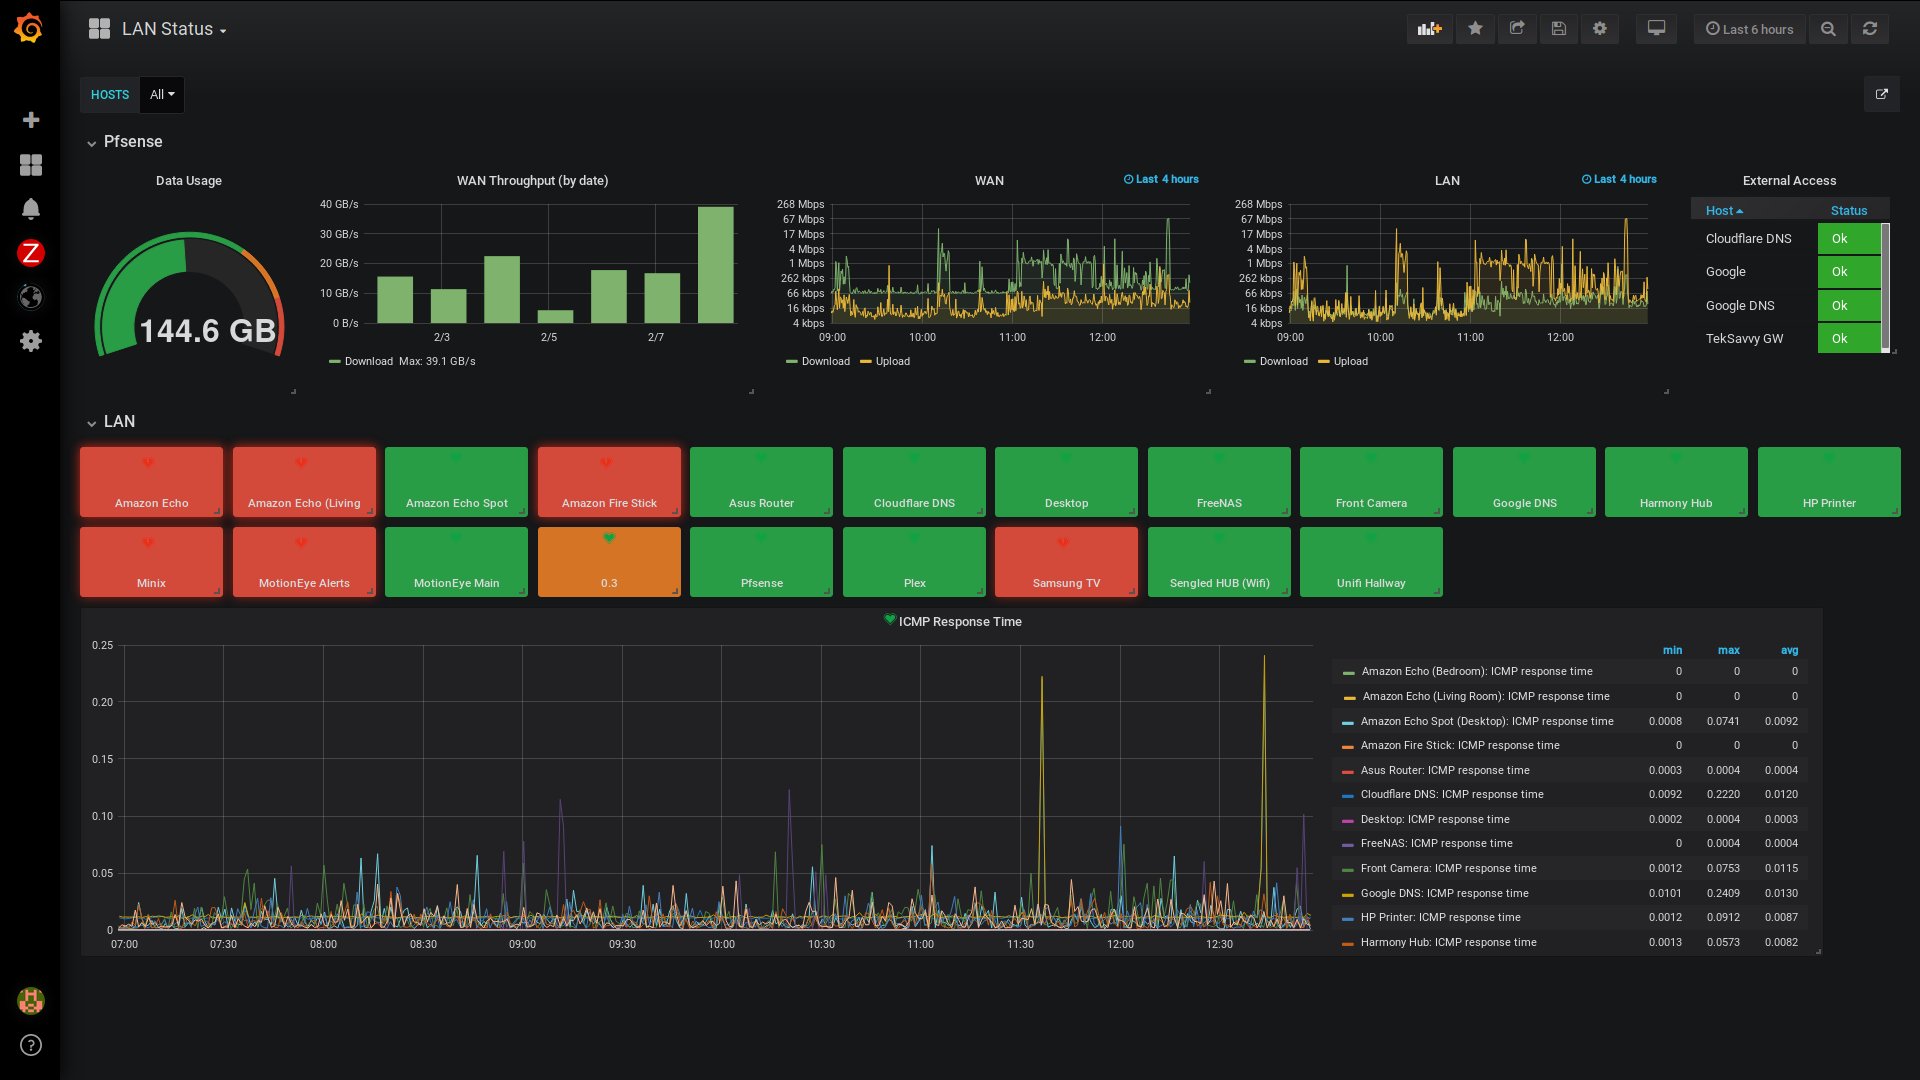
When I first started with Grafana, I was mainly using it with the Zabbix plugin and an imported pfSense dashboard. I had one influx database that was used with pfSense, and a MariaDB for the imported Zabbix data. The dashboard gave me a basic overview of my network data usage (pfSense) as well as status for my LAN devices (Zabbix).
Old dashboard
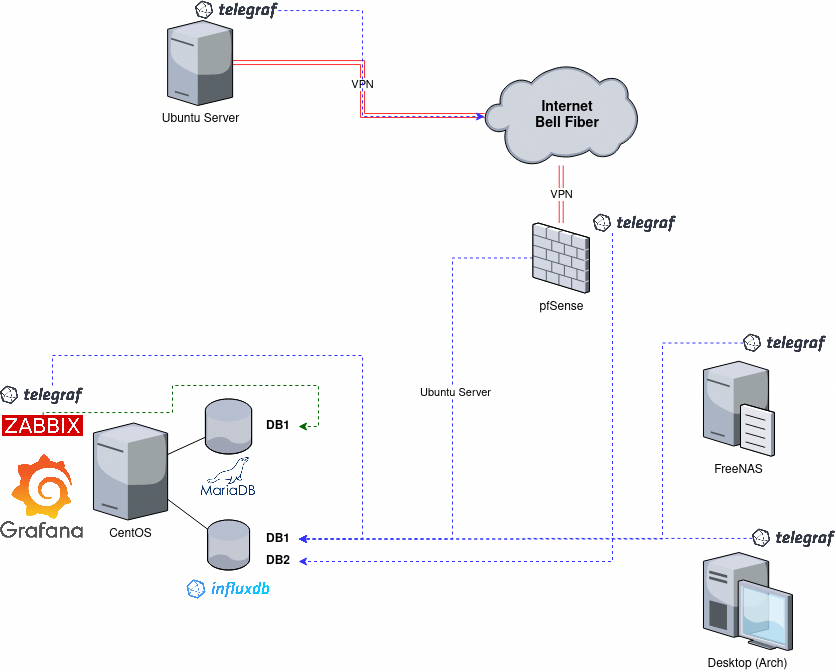
With the new configuration things got a bit more complex (as expected). I’m now displaying data from 5 different servers, with 2 different OS types (FreeBSD and Linux) and 5 different distributions (pfSense, FreeNAS, Arch, CentOS and Ubuntu). My collector of choice is Telegraf (due to it’s low resource and simplicity), and I have made an effort to stick to it throughout the different OSs in my design.
Collects server resources, network usage and UPS status
Desktop (Arch)
telegraf => InfluxDB (DB2)
Collects server resources and UPS status
FreeNAS
telegraf => InfluxDB (DB2)
Collects server resources and ZPOOL status/usage
Ubuntu
telegraf => InfluxDB (DB2)
Collects server resources, VPN status, IP address and ZPOOL status/usage
How it all looks together
As the proverb that says that “A pictures is worth a thousand words”, if you are visual person like me the diagram below will help you have a better understanding of the setup I listed above.
Breaking it Down
Now let’s dive a bit more into the current dashboard looking at what data is being displayed and from what data source.
I have divided the dashboard into 8 sections and labeled it with numbers (they may be small, but they are there).
Section 1: WAN Ping
Description: Displays ping status to 4 specific hosts
Information displayed:
Ping status to Google
Ping status to Google DNS
Ping status to Cludflare DNS
Ping status to my ISP’s gateway (Bell)
Data source: MariaDB (Zabbix)
Section 2: pfSense Network Data
Description: Diplays network related data from pfSense
Information displayed:
Monthly WAN data usage
Daily WAN data usage
Wan throughput
LAN thorughput
Data source: InfluxDB (DB1)
Section 3: pfSense OS Data
Description: Displays system resource for pfSense
Information displayed:
Status (up/down)
Uptime
Active users
CPU, memory, storage (ZFS) usage
UPS information
Data source:
InfluxDB (DB1)
Zabbix plugin
Section 4: FreeNAS
Description: Displays system resource for FreeNAS
Information displayed:
Status (up/down)
Plugin status (up/down)
Uptime
Active users
CPU, memory, storage (ZFS) usage
Data source:
InfluxDB (DB2)
Zabbix plugin
Section 5: Ubuntu
Description: Displays system resource for Ubuntu
Information displayed:
Status (up/down)
VPN status (up/down)
IP address
Uptime
Active users
CPU, memory, storage (ZFS) usage
Data source:
InfluxDB (DB2)
Zabbix plugin
Section 6: CentOS
Description: Displays system resource for CentOS
Information displayed:
Status (up/down)
Uptime
Active users
CPU, memory, storage usage
Data source:
InfluxDB (DB2)
Zabbix plugin
Section 7: Arch
Description: Displays system resource for Arch
Information displayed:
Status (up/down)
Uptime
Active users
CPU, memory, storage usage
UPS information
Data source:
InfluxDB (DB2)
Zabbix plugin
Section 8: LAN
Description: Diplays LAN related data
Information displayed:
ICMP ping history for LAN devices
Current status of LAN device (up/down)
Data source:
Conclusion
While I’m happy with this setup there is still some room for improvement (as there always is). At some point I would like to consolidate the two Influx databases, integrate Unifi Controller and SmartThings data, and possibly add a Plex dashboard as well.
Got any comments or questions? Feel free to leave them in the comment section below.