For the past few weeks I have been working extensively on the devices in my LAN. My FreeNAS had crashed due to a power outage resulting on a burnt memory module and a data issue with my main pool that caused a kernel panic on boot. My remote backup solution had not been working for over a year, so I knew that it would also need a complete re-design.
I rebuilt my FreeNAS pools and setup a new remote backup solution using ZFS send (FreeNAS => Ubuntu 20.04), and got a couple of UPSs to protect from future power failures. I also created a better backup structure and jobs for my main devices (will post about that later), and configured additional alerts for device availability and job status. And to tie all down together, I thought what better than to revamp my Grafana dashboard to show all this new info.
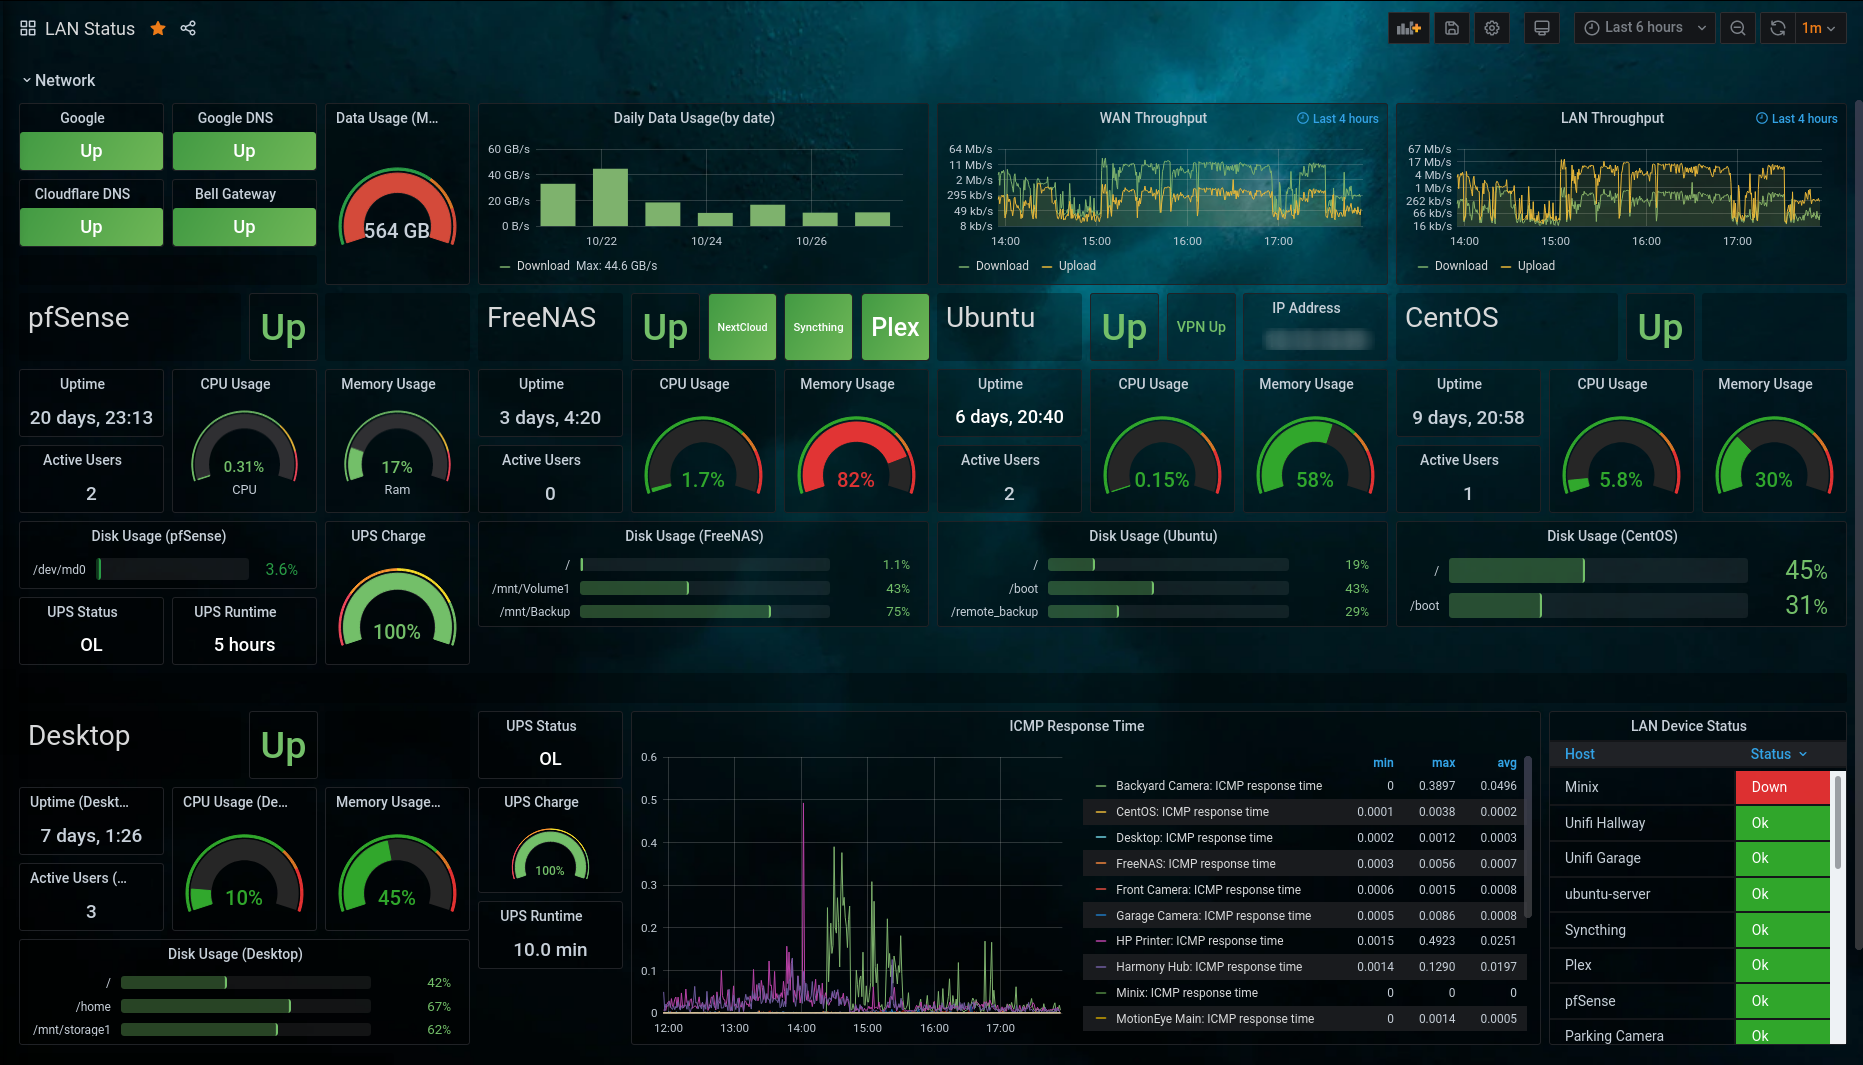
Here’s the final result! I’m quite happy with it.
How Everything is Placed Together
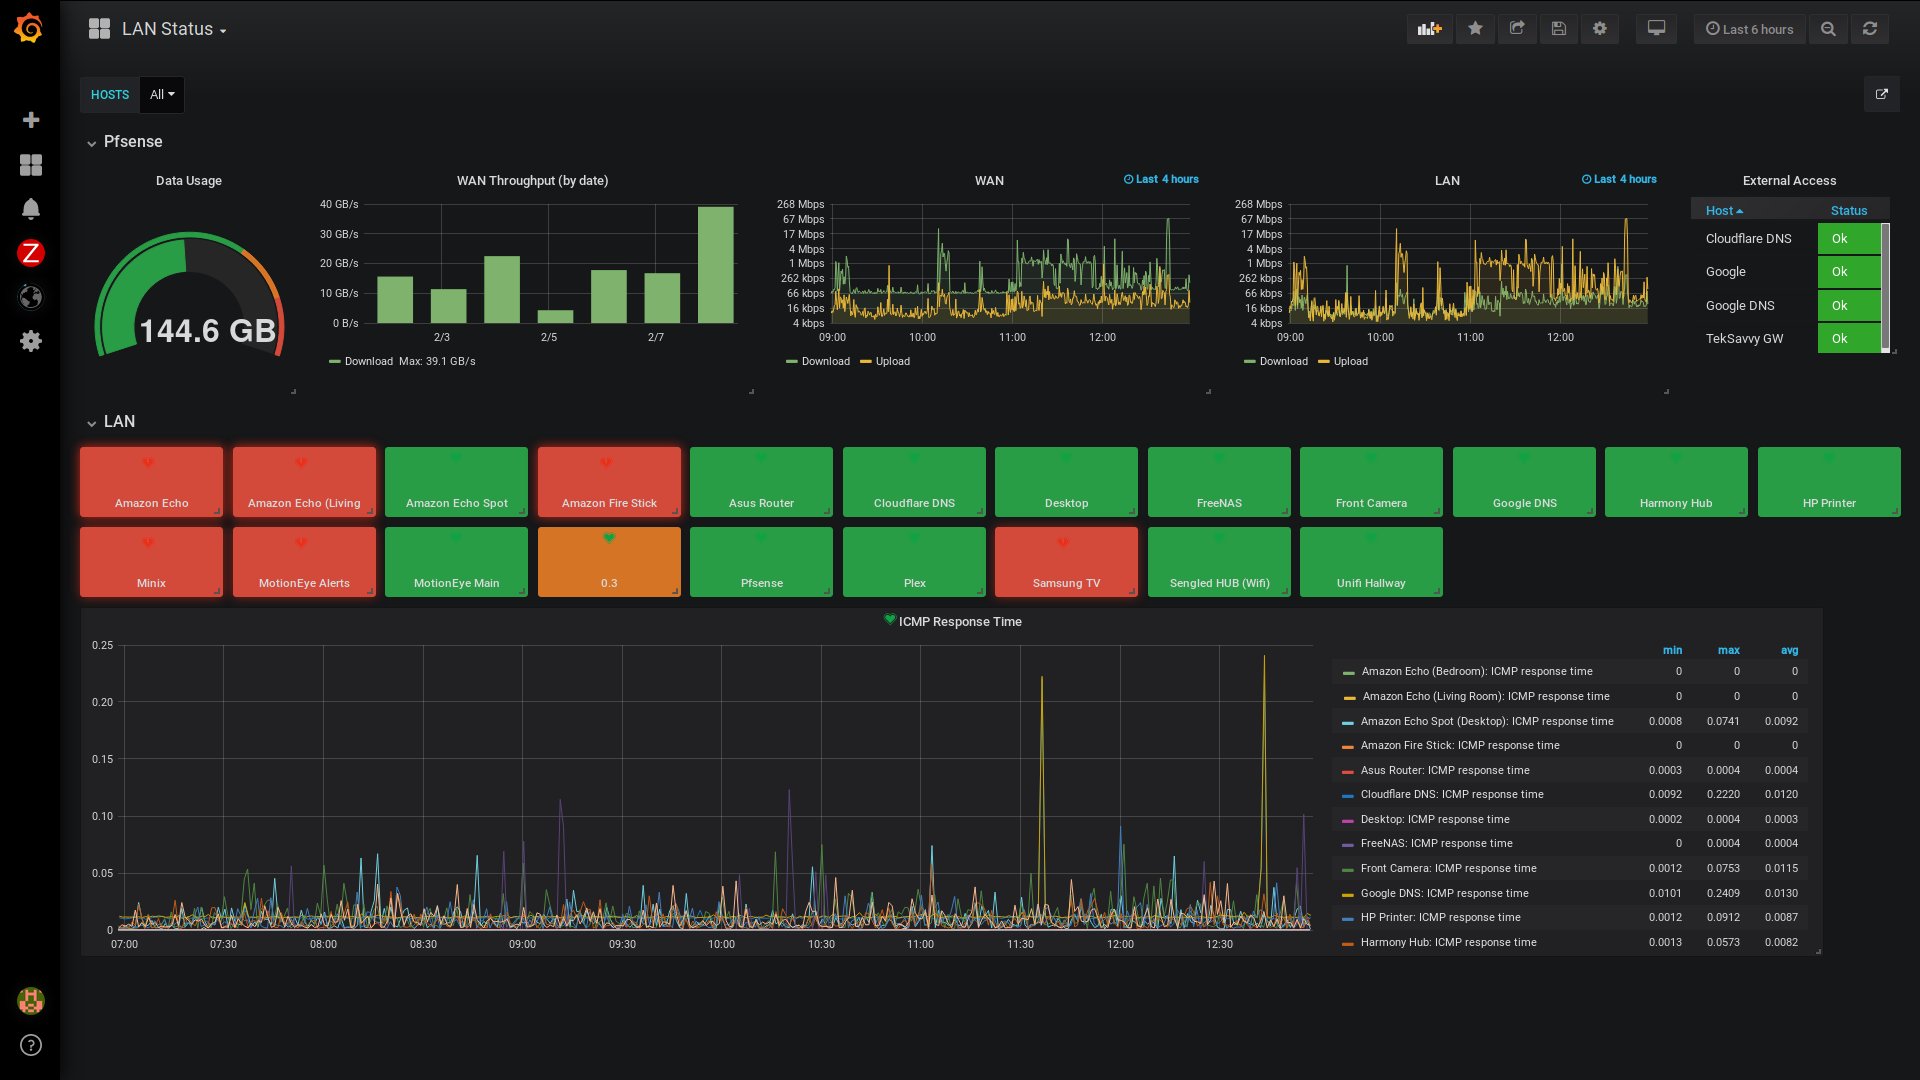
When I first started with Grafana, I was mainly using it with the Zabbix plugin and an imported pfSense dashboard. I had one influx database that was used with pfSense, and a MariaDB for the imported Zabbix data. The dashboard gave me a basic overview of my network data usage (pfSense) as well as status for my LAN devices (Zabbix).
Old dashboard
With the new configuration things got a bit more complex (as expected). I’m now displaying data from 5 different servers, with 2 different OS types (FreeBSD and Linux) and 5 different distributions (pfSense, FreeNAS, Arch, CentOS and Ubuntu). My collector of choice is Telegraf (due to it’s low resource and simplicity), and I have made an effort to stick to it throughout the different OSs in my design.
The Grafana Server
- OS: CentOS 7
- Databases:
- InfluxDB
- DB1 - pfsense
- DB2 - Linux/FreeNAS
- MariaDB
- zabbix
- InfluxDB
- Plugins:
- Zabbix - Zabbix plugin for Grafana | Grafana Labs
- worldPing - worldPing plugin for Grafana | Grafana Labs
- Pie Chart - Pie Chart plugin for Grafana | Grafana Labs
- Status Panel - Status Panel plugin for Grafana | Grafana Labs
- Imported Dashboards:
Collectors
- CentOS (also the Grafana server)
- Zabbix => MariaDB
- Collects LAN statistics
- telegraf => InfluxDB (DB2)
- Collects server resources
- Zabbix => MariaDB
- pfSense
- telegraf => InfluxDB (DB1)
- Collects server resources, network usage and UPS status
- telegraf => InfluxDB (DB1)
- Desktop (Arch)
- telegraf => InfluxDB (DB2)
- Collects server resources and UPS status
- telegraf => InfluxDB (DB2)
- FreeNAS
- telegraf => InfluxDB (DB2)
- Collects server resources and ZPOOL status/usage
- telegraf => InfluxDB (DB2)
- Ubuntu
- telegraf => InfluxDB (DB2)
- Collects server resources, VPN status, IP address and ZPOOL status/usage
- telegraf => InfluxDB (DB2)
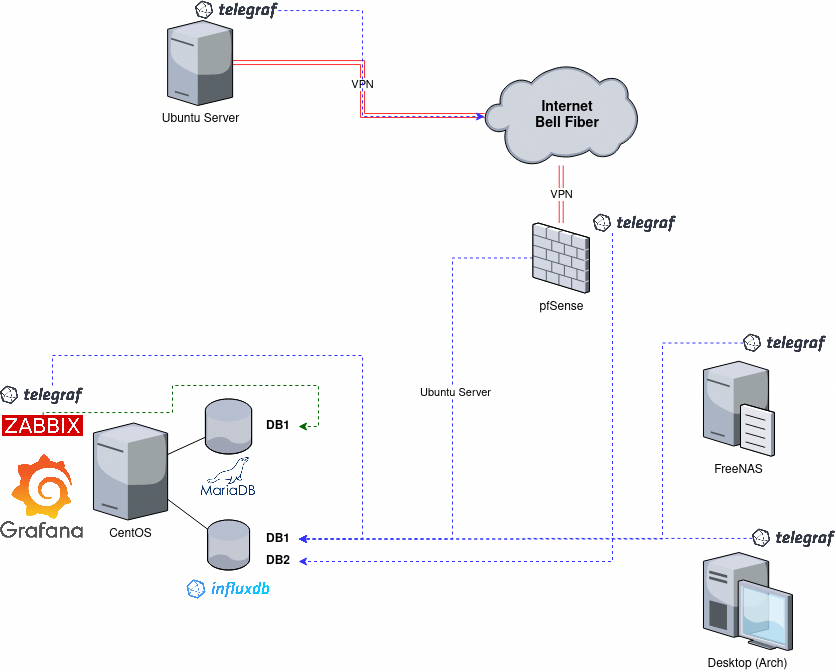
How it all looks together
As the proverb that says that “A pictures is worth a thousand words”, if you are visual person like me the diagram below will help you have a better understanding of the setup I listed above.
Breaking it Down
Now let’s dive a bit more into the current dashboard looking at what data is being displayed and from what data source.
I have divided the dashboard into 8 sections and labeled it with numbers (they may be small, but they are there).
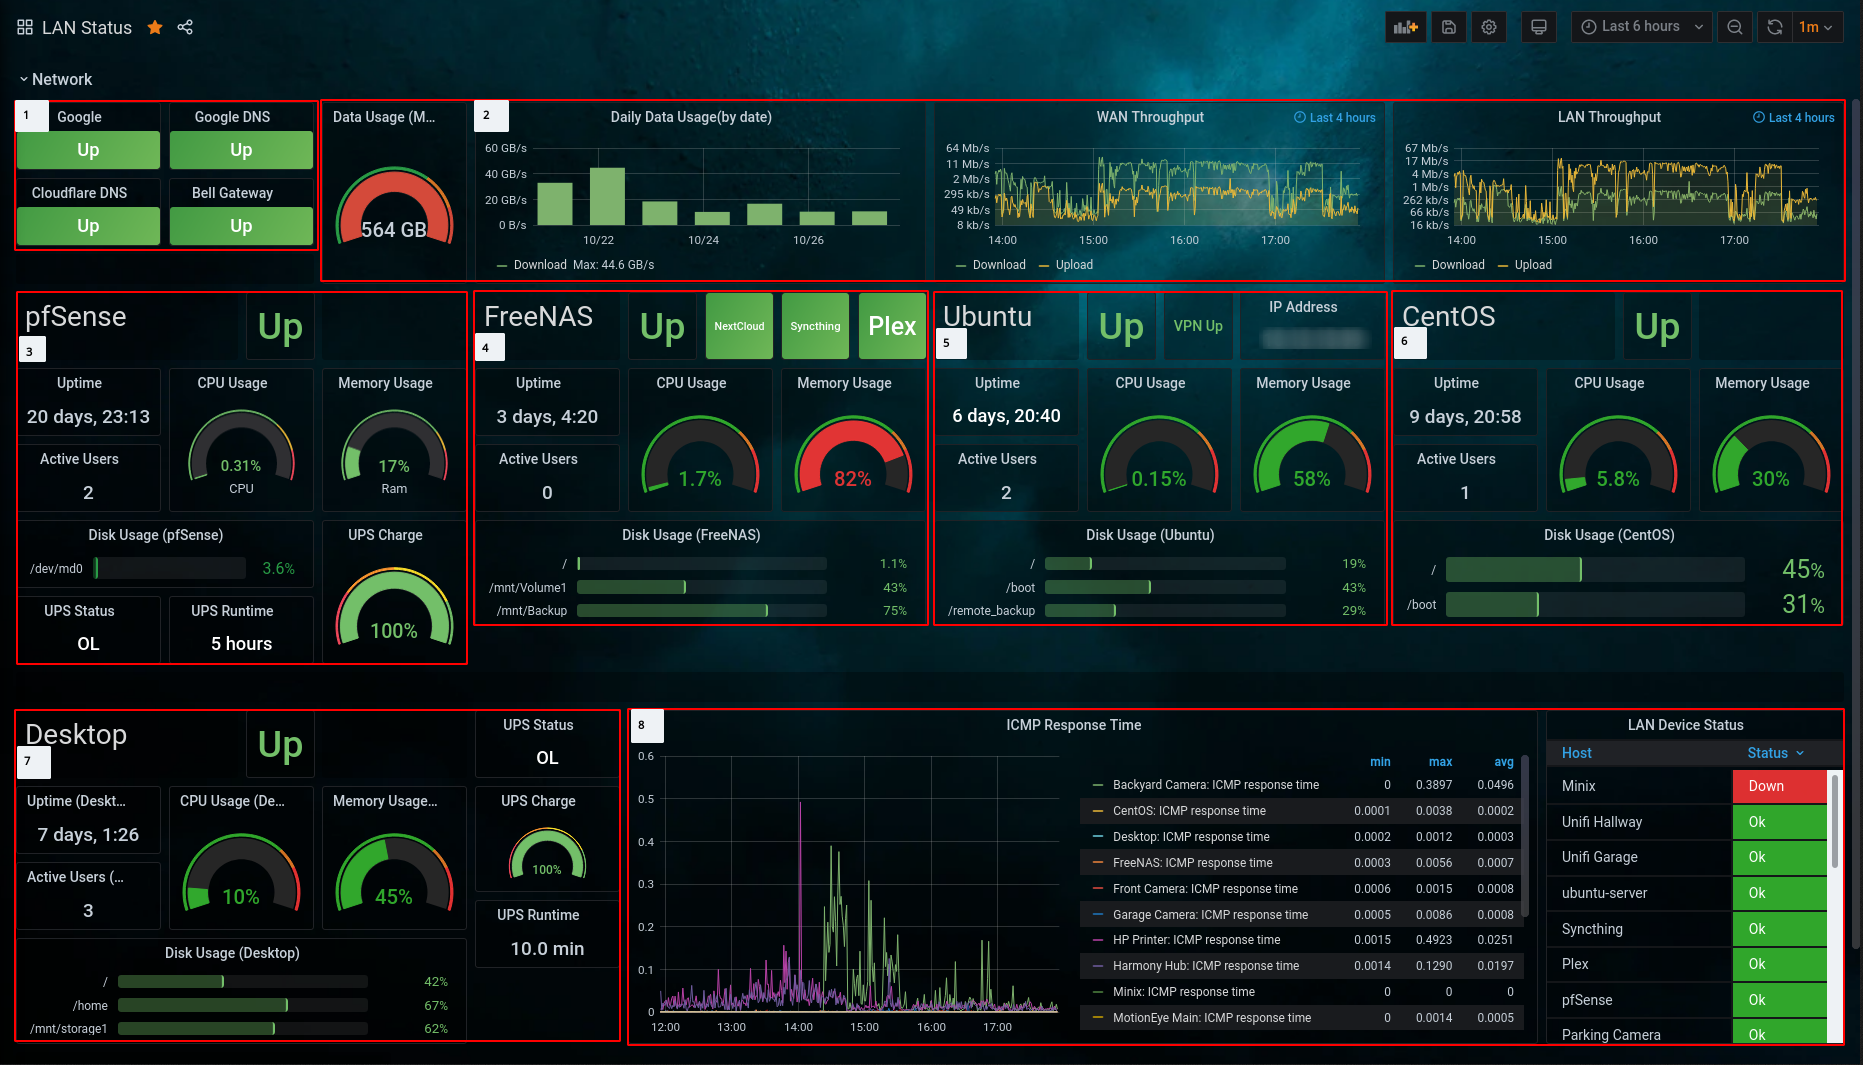
Section 1: WAN Ping
- Description: Displays ping status to 4 specific hosts
- Information displayed:
- Ping status to Google
- Ping status to Google DNS
- Ping status to Cludflare DNS
- Ping status to my ISP’s gateway (Bell)
- Data source: MariaDB (Zabbix)
Section 2: pfSense Network Data
- Description: Diplays network related data from pfSense
- Information displayed:
- Monthly WAN data usage
- Daily WAN data usage
- Wan throughput
- LAN thorughput
- Data source: InfluxDB (DB1)
Section 3: pfSense OS Data
- Description: Displays system resource for pfSense
- Information displayed:
- Status (up/down)
- Uptime
- Active users
- CPU, memory, storage (ZFS) usage
- UPS information
- Data source:
- InfluxDB (DB1)
- Zabbix plugin
Section 4: FreeNAS
- Description: Displays system resource for FreeNAS
- Information displayed:
- Status (up/down)
- Plugin status (up/down)
- Uptime
- Active users
- CPU, memory, storage (ZFS) usage
- Data source:
- InfluxDB (DB2)
- Zabbix plugin
Section 5: Ubuntu
- Description: Displays system resource for Ubuntu
- Information displayed:
- Status (up/down)
- VPN status (up/down)
- IP address
- Uptime
- Active users
- CPU, memory, storage (ZFS) usage
- Data source:
- InfluxDB (DB2)
- Zabbix plugin
Section 6: CentOS
- Description: Displays system resource for CentOS
- Information displayed:
- Status (up/down)
- Uptime
- Active users
- CPU, memory, storage usage
- Data source:
- InfluxDB (DB2)
- Zabbix plugin
Section 7: Arch
- Description: Displays system resource for Arch
- Information displayed:
- Status (up/down)
- Uptime
- Active users
- CPU, memory, storage usage
- UPS information
- Data source:
- InfluxDB (DB2)
- Zabbix plugin
Section 8: LAN
- Description: Diplays LAN related data
- Information displayed:
- ICMP ping history for LAN devices
- Current status of LAN device (up/down)
- Data source:
Conclusion
While I’m happy with this setup there is still some room for improvement (as there always is). At some point I would like to consolidate the two Influx databases, integrate Unifi Controller and SmartThings data, and possibly add a Plex dashboard as well.
Got any comments or questions? Feel free to leave them in the comment section below.