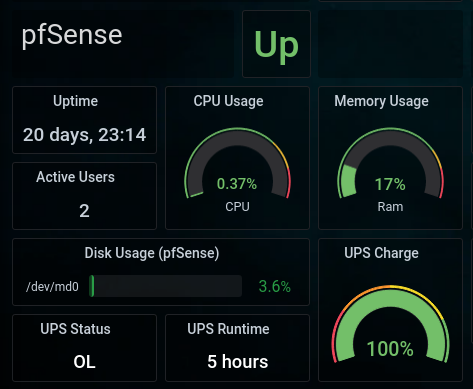
If you are running Grafana at home to monitor your devices, and you also have pfSense running off a UPS (if you don’t, check out my previous article on How to Setup a USB UPS on pfSense), you may want to pull UPS related data from pfSense.
My Grafana pfSense config

Instructions
a. Start by logging into your pfSense, go into “System => Package Manager = Available Packages” and install Telegraf
b. Now login to pfSense via ssh, and create a file in /usr/local/bin/getUpsData.py with the content below
Note: Make sure to change the UPS name in cmd="upsc BackUPSES750"
# https://github.com/sa7mon/ups-telegraf
from __future__ import print_function
import subprocess

cmd="upsc BackUPSES750"
output=""
string_measurements=["battery.charge","ups.status","battery.runtime"]

p = subprocess.Popen(cmd, shell=True, stdout=subprocess.PIPE)

for line in p.stdout.readlines(): #read and store result in log file
    line = line.decode("utf-8").rstrip()
    key = line[:line.find(":")]
    value = line[line.find(":")+2:]

    if key in string_measurements:
        if value.isalpha():
            value = '"' + value + '"'
        measurement = key + "=" + value
        if output != "":
            measurement = "," + measurement
        output += measurement

output = "ups,ups.name=BackUPSES750 " + output.rstrip()
print(output)
The output data will be as shown below. If you would like to format the output, refer to my instructions on my GitHub Repo - https://github.com/victorbrca/telegraf-plugins/tree/main/UPS
ups,ups.name=BackUPSES750 battery.charge=100,battery.runtime=18405,ups.status="OL"
c. Go back to pfSense UI and go into “Services => Telegraf”
d. Configure Telegraf as your usually would, and under “Additional configuration for Telegraf” add the configuration below:
[[inputs.exec]]
  commands = ["python2.7 /usr/local/etc/getUpsData.py"]
  timeout = "5s"
  data_format = "influx"
e. Restart Telegraf and check your influxdb for the new data being populated